
FIGURE
Figure 3
- ID
- ZDB-FIG-220430-183
- Publication
- Mat Zian et al., 2022 - Mapping Molecular Networks within Clitoria ternatea Linn. against LPS-Induced Neuroinflammation in Microglial Cells, with Molecular Docking and In Vivo Toxicity Assessment in Zebrafish
- Other Figures
- All Figure Page
- Back to All Figure Page
Figure 3
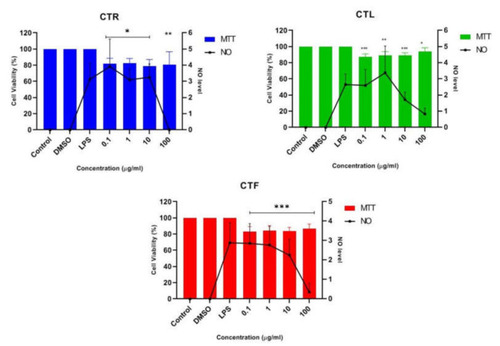
Figure 3. Effect of CTR, CTL, and CTF extracts on NO production in LPS-induced BV-2 cells for 24 h. The NO level is denoted as mean values ± SD, and n = 3. The extract showed dose-dependent inhibition of NO release. The value is statistically significant * (p < 0.05), ** (p < 0.01), and *** (p < 0.001) when compared with LPS alone.
|
Expression Data
Expression Detail
Antibody Labeling
Phenotype Data
Phenotype Detail
Acknowledgments
This image is the copyrighted work of the attributed author or publisher, and
ZFIN has permission only to display this image to its users.
Additional permissions should be obtained from the applicable author or publisher of the image.
Full text @ Pharmaceuticals (Basel)