
FIGURE
Figure 17
- ID
- ZDB-FIG-220430-201
- Publication
- Mat Zian et al., 2022 - Mapping Molecular Networks within Clitoria ternatea Linn. against LPS-Induced Neuroinflammation in Microglial Cells, with Molecular Docking and In Vivo Toxicity Assessment in Zebrafish
- Other Figures
- All Figure Page
- Back to All Figure Page
Figure 17
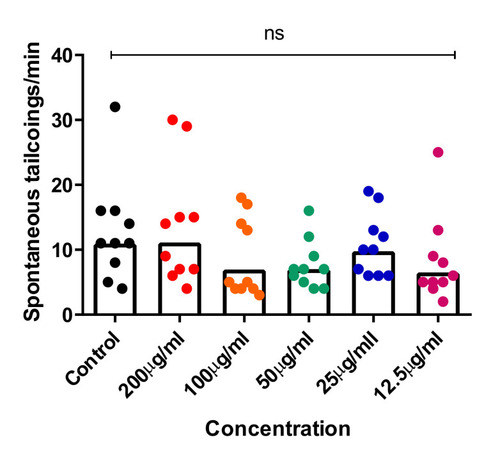
Figure 17. Tail-coiling rate in zebrafish embryos exposed to CTF_EA at different concentrations (200 µg/mL, 100 µg/mL, 50 µg/mL, 25 µg/mL, and 12.5 µg/mL) at 24 hpf developmental stage. Each dot represents the number of spontaneous tail coils per individual animal (n = 10 for each concentration). Mean values were expressed as bar graphs; ns means not significant.
|
Expression Data
Expression Detail
Antibody Labeling
Phenotype Data
Phenotype Detail
Acknowledgments
This image is the copyrighted work of the attributed author or publisher, and
ZFIN has permission only to display this image to its users.
Additional permissions should be obtained from the applicable author or publisher of the image.
Full text @ Pharmaceuticals (Basel)