
Image
|
Figure Caption
Figure 3
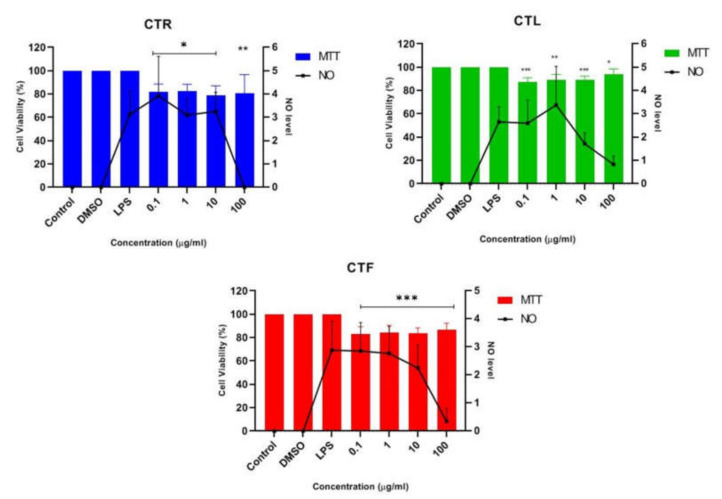
Figure 3. Effect of CTR, CTL, and CTF extracts on NO production in LPS-induced BV-2 cells for 24 h. The NO level is denoted as mean values ± SD, and n = 3. The extract showed dose-dependent inhibition of NO release. The value is statistically significant * (p < 0.05), ** (p < 0.01), and *** (p < 0.001) when compared with LPS alone.
Acknowledgments
This image is the copyrighted work of the attributed author or publisher, and
ZFIN has permission only to display this image to its users.
Additional permissions should be obtained from the applicable author or publisher of the image.
Full text @ Pharmaceuticals (Basel)