
FIGURE
Figure 19
- ID
- ZDB-FIG-220430-203
- Publication
- Mat Zian et al., 2022 - Mapping Molecular Networks within Clitoria ternatea Linn. against LPS-Induced Neuroinflammation in Microglial Cells, with Molecular Docking and In Vivo Toxicity Assessment in Zebrafish
- Other Figures
- All Figure Page
- Back to All Figure Page
Figure 19
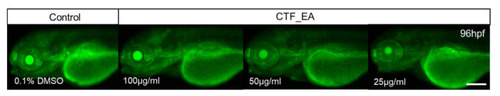
Figure 19. Visualization of apoptosis on CTF_EA-treated zebrafish larvae at different concentrations of 100 μg/mL, 50 μg/mL, and 25 μg/mL, respectively, using the vital fluorescent acridine orange staining. Signals in yolk and lens are autofluorescence. Scale bar, 200 µm.
|
Expression Data
Expression Detail
Antibody Labeling
Phenotype Data
Phenotype Detail
Acknowledgments
This image is the copyrighted work of the attributed author or publisher, and
ZFIN has permission only to display this image to its users.
Additional permissions should be obtained from the applicable author or publisher of the image.
Full text @ Pharmaceuticals (Basel)