
FIGURE
Figure 7
- ID
- ZDB-FIG-220430-189
- Publication
- Mat Zian et al., 2022 - Mapping Molecular Networks within Clitoria ternatea Linn. against LPS-Induced Neuroinflammation in Microglial Cells, with Molecular Docking and In Vivo Toxicity Assessment in Zebrafish
- Other Figures
- All Figure Page
- Back to All Figure Page
Figure 7
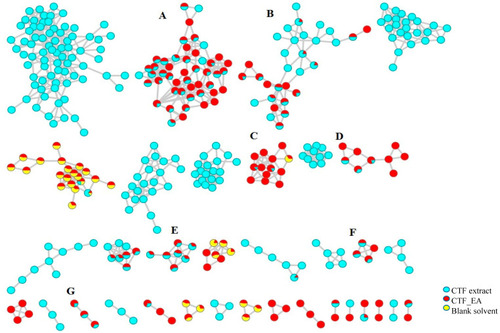
Figure 7. Full visualization of the molecular network in negative ion mode of the flower extract (CTF) and ethyl acetate fraction (CTF_EA) of C. ternatea. The annotated classes of metabolites are: (A) flavonol 3-O-glycosides, (B) hydrocinnamic acids and derivatives, (C) glycerophospholipid, (D) amino acids, (E) carbohydrates, (F) mono-methoxylflavonol 3-O-glycoside and (G) saccharolipid.
|
Expression Data
Expression Detail
Antibody Labeling
Phenotype Data
Phenotype Detail
Acknowledgments
This image is the copyrighted work of the attributed author or publisher, and
ZFIN has permission only to display this image to its users.
Additional permissions should be obtained from the applicable author or publisher of the image.
Full text @ Pharmaceuticals (Basel)