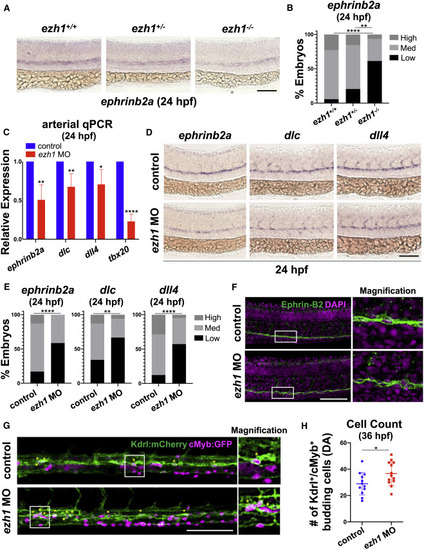
(A) WISH for ephrinb2a in ezh1+/+, ezh1+/−, ezh1−/− embryos at 24 hpf. Scale bar, 100 μm. (B) Qualitative phenotypic distribution plot of embryos in (A) (n ≥ 31 embryos/genotype; ∗∗p < 0.01, ∗∗∗∗p < 0.0001). (C) Whole-embryo ephrinb2a, dlc, dll4, and tbx20 qPCR on control and ezh1 morphants at 24 hpf relative to 18s (n ≥ 25 embryos/sample × 4 replicate clutches; two-tailed unpaired Student's t test, ∗∗p < 0.01, ∗p < 0.05, ∗∗∗∗p < 0.0001. Mean ± SEM). (D) WISH for arterial markers ephrinb2a, dlc, and dll4 in control and ezh1 morphants at 24 hpf. Scale bar, 100 μm. (E) Qualitative phenotypic distribution plot of embryos in (D) (n ≥ 42 embryos/condition; ∗∗p < 0.01, ∗∗∗∗p < 0.0001). (F) Confocal imaging of the DA from 24 hpf control and ezh1 morphant embryos. DAPI+ nuclei shown in magenta, Ephrin-B2+ cells shown in green. Scale bar, 100 μm. (G) Confocal imaging of Kdrl:mCherry+/cMyb:GFP+ budding HSPC cells in control and ezh1 morphants at 36 hpf in the DA. Scale bar, 100 μm. (H) Quantification of confocal images in (G) (n = 12 control, 13 ezh1 morphants; two-tailed unpaired Student's t test, ∗p < 0.05. Error bars indicate SD).
|
