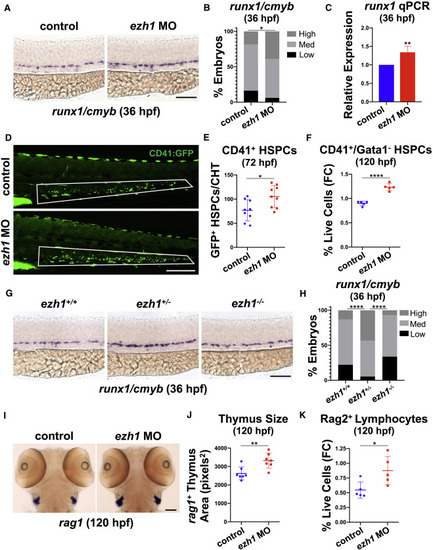
(A) WISH for runx1/cmyb in the DA of control and ezh1 morphants at 36 hpf. Scale bar, 100 μm. (B) Qualitative phenotypic distribution plot of embryos in (A) (n ≥ 49 embryos/condition; ∗p < 0.05). (C) Whole-embryo runx1 qPCR on control and ezh1 morphants at 36 hpf relative to 18s (n ≥ 25 embryos/sample × 4 replicate clutches; two-tailed unpaired Student's t test, ∗∗p < 0.01. Mean ± SEM). (D) In vivo imaging of CD41:GFP+ cells in the CHT at 72 hpf in control and ezh1 morphants. Scale bar, 200 μm. (E) Quantification of fluorescent images in (D) (n = 9 embryos/condition; two-tailed unpaired Student's t test, ∗p < 0.05. Error bars indicate SD). (F) Flow cytometry (FC) for CD41:GFP+/Gata1:dsRed− gated on percentage of live cells at 120 hpf in control and ezh1 morphants (n = 5 embryos/sample × 5 biological replicates; two-tailed unpaired Student's t test, ∗∗∗∗p < 0.0001. Error bars indicate SD). (G) WISH for runx1/cmyb in ezh1+/+, ezh1+/−, ezh1−/− embryos at 36 hpf. Scale bar, 100 μm. (H) Qualitative phenotypic distribution plot of embryos in (G) (n ≥ 74 embryos/genotype; ∗∗∗∗p < 0.0001). (I) WISH for rag1 expression in the thymus of control and ezh1 morphants at 120 hpf. Scale bar, 100 μm. (J) Quantification of thymic area in (I) (n = 7 embryos/condition; two-tailed unpaired Student's t test, ∗∗p < 0.01. Error bars indicate SD). (K) Flow cytometry (FC) for Rag2:GFP+ gated on percentage live cells at 120 hpf in control and ezh1 morphants (n = 5 embryos/sample × 5 biological replicates; two-tailed unpaired Student's t test, ∗p < 0.05. Error bars indicate SD).
|
