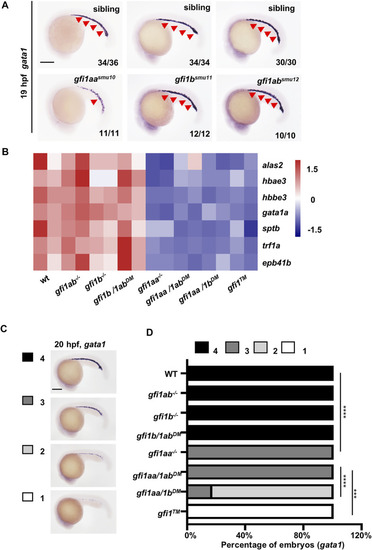
gfi1aa plays the key role in primitive erythropoiesis (A) Expression of gata1 was increased in gfi1aa smu10 mutants compared to siblings, whereas gfi1b smu11 and gfi1ab smu12 mutants show normal gata1 expression at 19 hpf by WISH. The numbers in the lower right corner indicate representative expression embryo numbers of the indicated marker. Scale bar: 200 μm (B) Heatmap of WT, gfi1aa −/− , gfi1b −/− , gfi1ab −/− signal mutant, gfi1aa/1b DM , gfi1aa/1ab DM , gfi1b/1ab DM double mutant and gfi1 TM triple mutant shows the gene expression levels of erythroid genes (alas2, hbae3, hbbe3, gata1a, sptb, trf1a, and epb41b). The color scale indicated the expression level (C,D) Expression of gata1 was decreased in gfi1aa related mutant (gfi1aa −/− , gfi1aa/1ab DM , gfi1aa/1b DM , and gfi1 TM ) compared to WT and other mutants at 20 hpf by WISH (C) The gfi1aa +/- ; gfi1b +/- ; gfi1ab +/- intercross embryos were divided into four categories according to gata1 expression (D) The percentage of WT, gfi1aa −/− , gfi1b −/− , gfi1ab −/− signal mutant, gfi1aa/1b DM , gfi1aa/1ab DM , gfi1b/1ab DM double mutant and gfi1 TM triple mutant according to the categories (****p < 0.0001, ***p < 0.001, Fisher exact tests, n ≥ 10 for each group).