
Fig. 1
- ID
- ZDB-FIG-211206-2
- Publication
- Jin et al., 2021 - Copper ions impair zebrafish skeletal myofibrillogenesis via epigenetic regulation
- Other Figures
- All Figure Page
- Back to All Figure Page
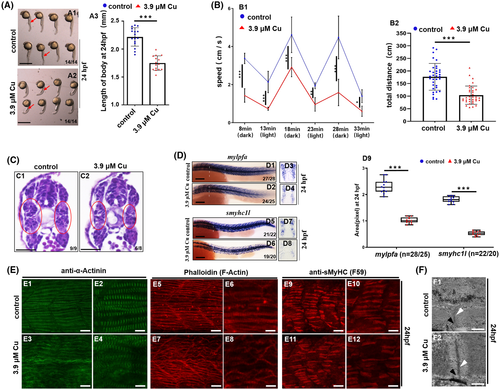
Cu2+-stressed zebrafish larvae exhibited dysfunctional locomotor behaviors and defective myofibrillogenesis. A, The phenotype of Cu2+-stressed zebrafish embryos at 24 hpf (A2). A3, statistical analysis for body length. Each dot represents the body length of one individual embryo. B, Cu2+-stressed zebrafish larvae exhibited significantly reduced speed (B1) and total distance (B2) compared with WT larvae (C) Representative histological images (transverse sections) of skeletal muscle tissues, with the difference between the Cu2+-treated (C2) and control embryos (C1) in the muscle structures highlighted by red circles. C1, C2, dorsal to the up. D, WISH detections for fast muscle fiber (mylpfa) (D1-D4), slow muscle fiber (smyhc1l) specification (D5-D8) in embryos with/without Cu2+ treatment. D9, mylpfa or smyhc1l expression level was calculated based on WISH data. Each dot represents the signal level in a representative individual embryo. n, indicating the number of the calculated embryos in each group. E, Immunohistochemistry for anti-α-Actinin (green, marking the Z-disc) (E1-E4) and anti-sMyHC (slow muscle myosin, F59, red) (E9-E12), and phalloidin labelling F-Actin (red) (E5-E8) in trunk muscles of the control and the Cu2+- stressed embryos at 24hpf. F, TEM analysis of sarcomere organization in skeletal muscle fibers of the control (F1) and the Cu2+-stressed embryos (F2) at 24hpf. Black arrowheads indicate sarcoplasmic reticulum with triads, and white arrowheads indicate Z-discs. Each experiment was repeated two or three times with similar results, and a representative result is shown. D1, D2, D5, D6, E1-E12, lateral view, anterior to the left and dorsal to the up. D3, D4, transverse sections (white lines indicating domain) for D1, D2, respectively; D7, D8, transverse sections (white lines indicating domain) for D5, D6, respectively; F1, F2, longitudinal sections of trunk. *P < .05, **P < .01. ***P < .001. NS, not significant. A1, A2, D1-D8, scale bar, 250 μm; C1, C2, scale bar, 200 μm. E1, E3, E5, E7, E9, E11, scale bar: 30 μm; E2, E4, E6, E8, E10, E12, scale bar: 60 μm; F1, F2, scale bar: 500 nm |