
- Title
-
Copper ions impair zebrafish skeletal myofibrillogenesis via epigenetic regulation
- Authors
- Jin, X., Liu, W., Miao, J., Tai, Z., Li, L., Guan, P., Liu, J.X.
- Source
- Full text @ FASEB J.
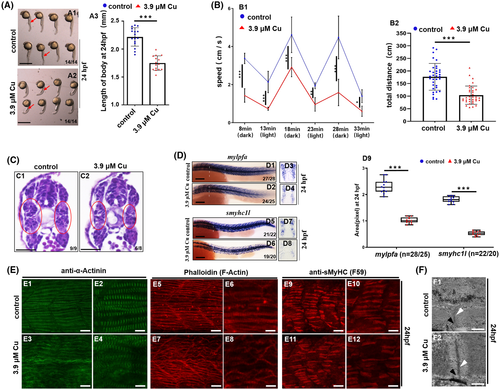
Cu2+-stressed zebrafish larvae exhibited dysfunctional locomotor behaviors and defective myofibrillogenesis. A, The phenotype of Cu2+-stressed zebrafish embryos at 24 hpf (A2). A3, statistical analysis for body length. Each dot represents the body length of one individual embryo. B, Cu2+-stressed zebrafish larvae exhibited significantly reduced speed (B1) and total distance (B2) compared with WT larvae (C) Representative histological images (transverse sections) of skeletal muscle tissues, with the difference between the Cu2+-treated (C2) and control embryos (C1) in the muscle structures highlighted by red circles. C1, C2, dorsal to the up. D, WISH detections for fast muscle fiber (mylpfa) (D1-D4), slow muscle fiber (smyhc1l) specification (D5-D8) in embryos with/without Cu2+ treatment. D9, mylpfa or smyhc1l expression level was calculated based on WISH data. Each dot represents the signal level in a representative individual embryo. n, indicating the number of the calculated embryos in each group. E, Immunohistochemistry for anti-α-Actinin (green, marking the Z-disc) (E1-E4) and anti-sMyHC (slow muscle myosin, F59, red) (E9-E12), and phalloidin labelling F-Actin (red) (E5-E8) in trunk muscles of the control and the Cu2+- stressed embryos at 24hpf. F, TEM analysis of sarcomere organization in skeletal muscle fibers of the control (F1) and the Cu2+-stressed embryos (F2) at 24hpf. Black arrowheads indicate sarcoplasmic reticulum with triads, and white arrowheads indicate Z-discs. Each experiment was repeated two or three times with similar results, and a representative result is shown. D1, D2, D5, D6, E1-E12, lateral view, anterior to the left and dorsal to the up. D3, D4, transverse sections (white lines indicating domain) for D1, D2, respectively; D7, D8, transverse sections (white lines indicating domain) for D5, D6, respectively; F1, F2, longitudinal sections of trunk. *P < .05, **P < .01. ***P < .001. NS, not significant. A1, A2, D1-D8, scale bar, 250 μm; C1, C2, scale bar, 200 μm. E1, E3, E5, E7, E9, E11, scale bar: 30 μm; E2, E4, E6, E8, E10, E12, scale bar: 60 μm; F1, F2, scale bar: 500 nm |
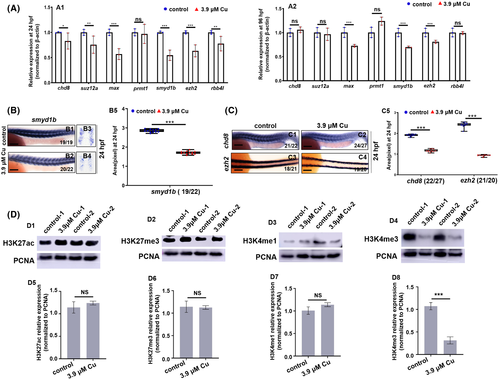
Cu2+-stressed zebrafish larvae exhibited significantly downregulated expression of gene smyd1b and downregulated level of H3K4me3 protein. A, Expression of methyltransferase complex and histone methyltransferase complex genes in Cu2+-stressed embryos and larvae at 24 hpf. (A1) and 96 hpf (A2), respectively. Expression levels of control were set at 1. B, Trunk muscle cell expression of smyd1b in the control and the Cu2+-stressed embryos at 24 hpf (B1-B4). B5, smyd1b expression level calculated based on WISH data. Each dot represents the signal level in a representative individual embryo in each group. C, Expression of chd8 and ezh2 in the control and the Cu2+-stressed embryos at 24 hpf (C1-C4). C5, chd8 or ezh2 expression level calculated based on WISH data. Each dot represents the signal level in a representative individual embryo in each group. D, Protein levels of H3K27ac, H3K27me3, H3K4me1, and H3K4me3 in the control and the Cu2+-stressed embryos at 24 hpf (D1-D4) and the quantitative analysis of protein level in each sample (D5-D8). Each experiment was repeated two or three times with similar results, and a representative result is shown. B1, B2, C1, C2, lateral view, anterior to the left. C3, C4, dorsal view, anterior to the left. B3, B4, transverse sections for B1, B2, respectively. B1, B2, C1-C4, scale bar, 250 μm. *P < .05, **P < .01, ***P < .001. NS, not significant |
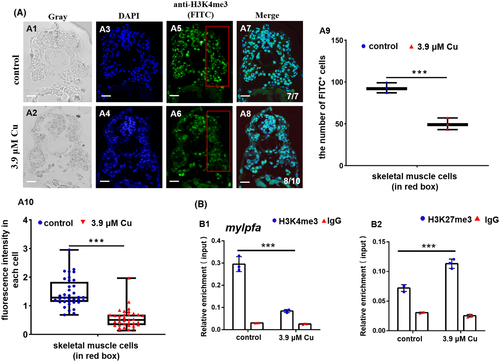
Cu2+-stressed zebrafish embryonic muscle cells exhibited reduction in both the H3K4me3 protein level and the binding enrichment of H3K4me3 protein on muscle fiber gene mylpfa promoter. A, Protein level of H3K4me3 in Cu2+-stressed zebrafish embryonic muscle cells. A1, A2, gray; A3, A4, DAPI; A5, A6, FITC; A7, A8, merged. A9, DAPI+ FITC+ cell numbers calculated in the fixed red boxes in A5 and A6, respectively. A10: FITC intensity calculated for each cell (50-100 cells/sample) in A5 and A6, respectively. Each dot represents the fluorescence intensity in each cell. B, Reduced binding enrichment of protein H3K4me3 (B1) while increased binding enrichment of protein H3K27me3 (B2) for the muscle fiber gene mylpfa promoter as revealed by chromatin immunoprecipitation assays (ChIP). Anti-H3K4me3 and Anti-H3K27me3 were used for ChIP assays in the control and the Cu2+-stressed embryonic cells, with anti-IgG used as negative control. Each experiment was repeated two or three times with similar results, and a representative result is shown. A1-A8, transverse sections. *P < .05, **P < .01, ***P < .001. NS, not significant. A1-A8, scale bar, 100 μm |
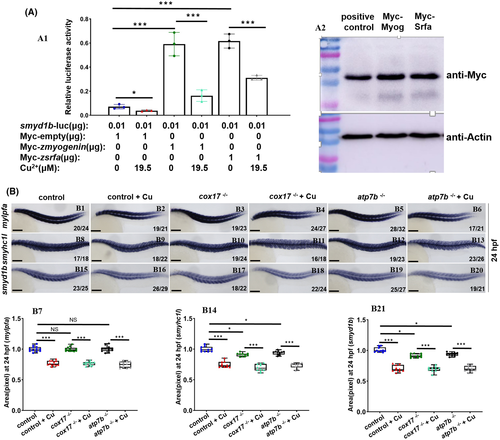
Cu2+ directly suppressed smyd1b and myofibrillogenesis independent of the integral function of cox17 or atp7b. (A1) Cu2+ directly suppressed the transcriptional activity of the smyd1b promoter and thus the transcriptional activation of Myog and Srfa. (A2) WB assays of the ectopic expression of Myc tagged Myog and Srfa protein, respectively, with Myc tagged hEaf2 as the positive control.27, 28 B, WISH assays of mylpfa (B1-B6), smyhc1l (B8-B13), and smyd1b (B15-B20) expression in cox17−/− or atp7b−/− mutants with or without Cu2+ stresses. B7, B14, B21, the calculated expression of mylpfa, smyhc1l, or smyd1b in different groups. Each dot represents the signal level in a representative individual embryo. Each experiment was repeated two or three times with similar results, and a representative result is shown. B1-B6, B8-B13, B15-B20, lateral view, and anterior to the left. B1-B6, B8-B13, B15-B20, scale bar, 250 μm; *P < .05, **P < .01, ***P < .001. NS, not significant |
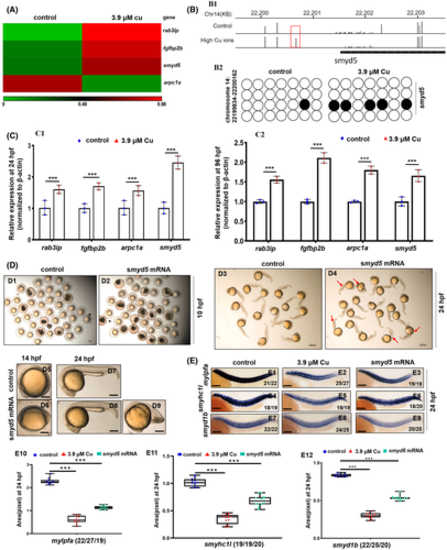
Cu2+-stressed zebrafish embryonic muscle genes exhibited changes in the promoter methylation level, and the ectopic expression of smyd5 could phenocopy the defective myofibrillogenesis observed in Cu2+-stressed embryos. A, Heat map for the methylation levels of genes rap3ip, fgfbp2b, arpc1a, and smyd5 in the control and the Cu2+-stressed larvae based on bisulfite sequencing data. B, Graphical representation of methylation patterns in the promoter domain of gene smyd5 in the Cu2+-stressed and the control larvae at 96 hpf (B1); (B2) Dynamic changes of DNA methylation for a representative locus (in the red box in B1) in the smyd5 promoter. Open circles represent un-methylated CpG base, and filled circles represent methylated CpG base. C, Expression of muscle cell methylated genes rap3ip, fgfbp2b, arpc1a, and smyd5 in the Cu2+-stressed embryos and larvae at 24 hpf (C1) and 96 hpf (C2), respectively. D, Representative control embryos and larvae (D1, D3, D5 and D7) and the embryos and larvae with the ectopic expression of smyd5 mRNA (D2, D4, D6, D8 and D9). Black embryos in panels D1 and D2 indicated dead embryos, and red arrows in panel D4 indicated abnormal embryos with shorter bodies. D5-D9, lateral view, anterior to the left. E, Muscle fiber specification in embryos with the ectopic expression of smyd5 mRNA. E1-E3, fast muscle fiber marker mylpfa; E4-E6, slow muscle fiber marker smyhc1l; E7-E9, muscle cell marker smyd1b; E10, E11, E12, calculation of mylpfa, smyhc1l, and smyd1b expression level in each embryo from different groups, respectively. Each dot represents the signal level in a representative individual embryo. Each experiment was repeated two or three times with similar results, and a representative result is shown. E1-E9, lateral view, and anterior to the left. D5-D9, scale bar, 60 μm; E1-E9, scale bar, 250 μm. *P < .05, **P < .01, ***P < .001. NS, not significant |
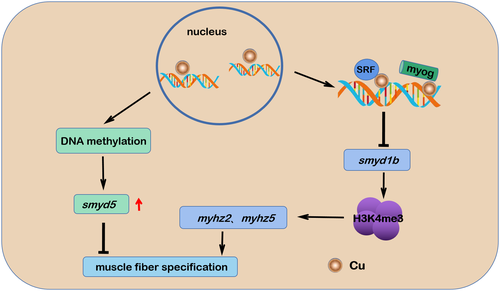
Working model for how Cu2+ induces myofibrillogenesis defects. Cu2+ overload in the embryonic cells of Cu2+-stressed embryos and larvae led to the downregulation of the smyd1b-H3K4me3 signaling axis and changed the promoter methylation level of gene smyd5. The downregulated expression of smyd1b and the up-regulated expression of smyd5 might contribute jointly to the occurrence of muscle fiber specification defects in Cu2+-stressed embryos and larvae |
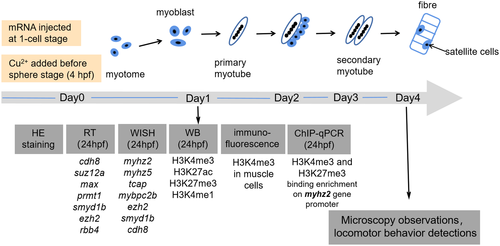
The schema of the experimental program in this study |