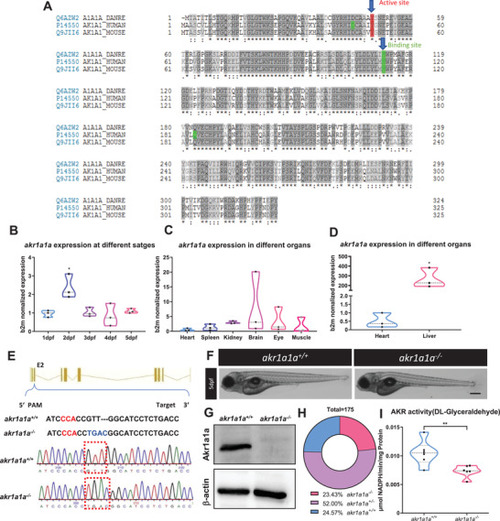
Sequence alignment of Akr1a1a across different species and generation of Akr1a1a knockout zebrafish by using CRISPR‐Cas9 technology. A) The amino acid alignment showed a high similarity between the different species on the active site (red frame) and binding site (green); first line: zebrafish AKR1a1a; second line: human AKR1a1; third line: mouse AKR1a1. B) akr1a1a mRNA expression in wild‐type zebrafish larvae showed a significant upregulation at 2 dpf. C,D) akr1a1a mRNA expressed mostly in liver of wild‐type adult zebrafish (heart as reference organ). Expression of genes was determined by RT‐qPCR and normalized to b2m. Larval stage: n = 3 clutches with 30 larvae, adult organs: n = 3 with one organ per sample. E) Akr1a1a‐CRISPR‐target site was designed in exon 2 of the akr1a1a gene and CRISPR/Cas9‐induced deletion‐insertion of four nucleotides was selected for further akr1a1a mutant line generation and maintenance. Genotype was analyzed via sequencing chromatograms of PCR‐amplified akr1a1a region, containing the akr1a1a target site. Chromatogram shows akr1a1a wild type and deletion‐insertion of four nucleotides homozygous sequencing results. F) Microscopic images showed unaltered morphology of akr1a1a−/− larvae in comparison with akr1a1a+/+ larvae at 5dpf. Black scale bar: 300 µm. G) Western blot for Akr1a1a expression in adult liver showed the loss of Akr1a1a protein in mutants. b‐actin served as loading control. n = 3, each lane represents one liver sample from according adult fish. H) Adult fish number among different genotypes was in line with the Mendelian Inheritance in the first generation of F2: akr1a1a+/+ = 43, akr1a1a+/‐ = 91, aldh3a1−/− = 41. I) akr1a1a−/− zebrafish showed decreased enzyme activity (DL‐Glyceraldehyde served as substrate) measured by spectrophotometric analysis in zebrafish lysates at 96 hpf; n = 6–11 clutches, each clutch contains 50 larvae. For statistical analysis one‐way ANOVA followed by Tukey's multiple comparison test and Student's t‐test was applied, *p < 0.05. **p < 0.01. RT‐qPCR, real‐time quantitative polymerase chain reaction; dpf, day post fertilization; b2m, β2 microglobulin. PAM, protospacer‐adjacent motif.
|
