FIGURE

Figure 1

ID
ZDB-FIG-210822-1
Publication
Heliste et al., 2021 - Combined genetic and chemical screens indicate protective potential for EGFR inhibition to cardiomyocytes under hypoxia
Other Figures
All Figure Page
Back to All Figure Page
Figure 1

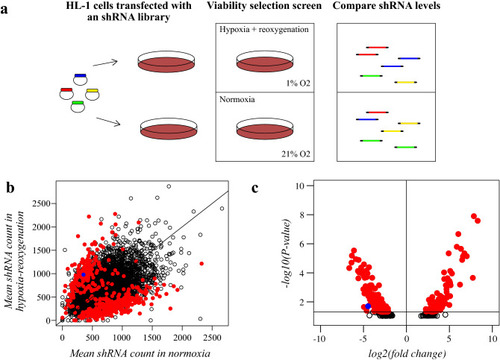
shRNA library screening to identify modulators of cardiomyocyte survival. (a) Schematic overview of the shRNA library screen. HL-1 cells were transduced with a lentiviral shRNA library targeting 4625 genes. Cells were exposed to hypoxia-reoxygenation for a viability dropout screen. As the readout, shRNA abundances were quantified with NGS. (b) Scatter plot illustrating the mean copy number of barcoded shRNAs for each gene after culturing of the cells in normoxia (x-axis) or in hypoxia followed by reoxygenation (y-axis). Significantly regulated genes are depicted with red dots. The dot representing the mean copy number of shRNAs targeting EGFR is indicated in blue. Line depicts the level where shRNA abundances are equal in normoxia and hypoxia-reoxygenation. (c) Volcano plot of log2-transformed fold-changes of mean shRNA counts in normoxic cells and in hypoxia-reoxygenation-treated cells and their respective P values from DESeq2 analysis. Significantly regulated genes are depicted with red dots. The dot representing EGFR is indicated in blue.

Expression Data

Expression Detail
Antibody Labeling
Phenotype Data

Phenotype Detail
Acknowledgments
This image is the copyrighted work of the attributed author or publisher, and ZFIN has permission only to display this image to its users. Additional permissions should be obtained from the applicable author or publisher of the image. Full text @ Sci. Rep.