FIGURE

Figure 4

ID
ZDB-FIG-210822-4
Publication
Heliste et al., 2021 - Combined genetic and chemical screens indicate protective potential for EGFR inhibition to cardiomyocytes under hypoxia
Other Figures
All Figure Page
Back to All Figure Page
Figure 4

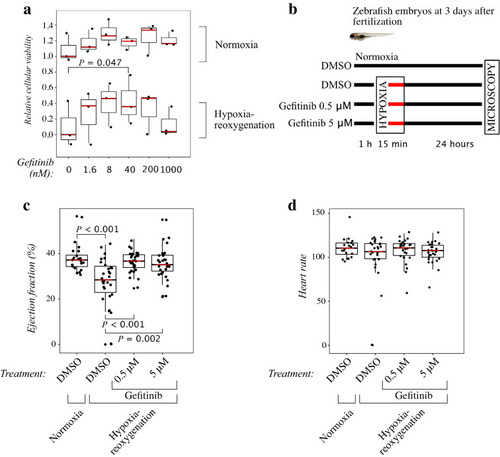
Effects of gefitinib on cardiomyocytes and zebrafish embryos challenged with hypoxia-reoxygenation. (a) Cellular viability of HL-1 cells treated with increasing concentrations of gefitinib. Cells were cultured in normoxia or exposed to 24-h hypoxia followed by 24-h reoxygenation. Cellular viability was measured using CTG assays. N = 3. One-way ANOVA followed by paired T-test and FDR-correction of P values were used for statistical analyses. Data were normalized by setting the median viability of untreated, normoxic controls to one and median viability of hypoxia-reoxygenation treated control samples to zero. (b) Outline of zebrafish embryo experiments. Embryos were treated for 1 h with 0, 0.5 or 5 μM of gefitinib before being exposed to hypoxia for 15 min and reoxygenation for 24 h. (c,d) Ventricular ejection fraction (c) and heart rate (d) of zebrafish embryos exposed to 15 min of hypoxia followed by reoxygenation for 24 h. The embryos were treated with 0, 0.5 or 5 μM of gefitinib. N = 20 for embryos in normoxia, n = 30 for all groups treated with hypoxia-reoxygenation. Kruskal–Wallis test followed by Mann–Whitney U test and subsequent FDR-correction of P values were used for statistical analyses.

Expression Data

Expression Detail
Antibody Labeling
Phenotype Data
Fish:
Conditions:
Observed In:
Stage: Protruding-mouth

Phenotype Detail
Acknowledgments
This image is the copyrighted work of the attributed author or publisher, and ZFIN has permission only to display this image to its users. Additional permissions should be obtained from the applicable author or publisher of the image. Full text @ Sci. Rep.