FIGURE

Figure 5

ID
ZDB-FIG-210822-5
Publication
Heliste et al., 2021 - Combined genetic and chemical screens indicate protective potential for EGFR inhibition to cardiomyocytes under hypoxia
Other Figures
All Figure Page
Back to All Figure Page
Figure 5

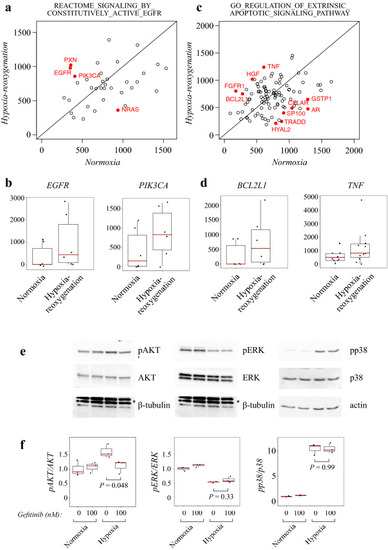
Pathways involved in hypoxia-reoxygenation response and EGFR-mediated signal transduction. (a) Scatterplot of mean reads of shRNAs (normoxia vs. hypoxia-reoxygenation) against genes in the pathway REACTOME_SIGNALING_BY_CONSTITUTIVELY_ACTIVE_EGFR. Significantly differentially expressed genes are depicted with red dots and labels. (b) Boxplots of reads for shRNAs against EGFR and PIK3CA. (c) Scatterplot of mean reads of shRNAs against genes in the pathway GO_REGULATION_OF_EXTRINSIC_APOPTOTIC_SIGNALING_PATHWAY. Significantly differentially expressed genes are depicted with red dots and labels. (d) Boxplots of reads for shRNAs against BCL2L1 and TNF. (e) Western analysis of phosphorylated and total AKT, ERK and p38 in HL-1 cells treated overnight with 0 or 100 nM of gefitinib and exposed to hypoxia for 3 h. β-Tubulin (the lowest band) or actin were used as loading controls, * = non-specific bands. (f) Densitometric analysis of phosphorylated AKT, ERK and p38 against total protein levels (arbitrary units). N = 3 biological replicates. One-way ANOVA followed by paired T-test was used for statistical comparisons.

Expression Data

Expression Detail
Antibody Labeling
Phenotype Data

Phenotype Detail
Acknowledgments
This image is the copyrighted work of the attributed author or publisher, and ZFIN has permission only to display this image to its users. Additional permissions should be obtained from the applicable author or publisher of the image. Full text @ Sci. Rep.