FIGURE

Figure 3

ID
ZDB-FIG-210822-3
Publication
Heliste et al., 2021 - Combined genetic and chemical screens indicate protective potential for EGFR inhibition to cardiomyocytes under hypoxia
Other Figures
All Figure Page
Back to All Figure Page
Figure 3

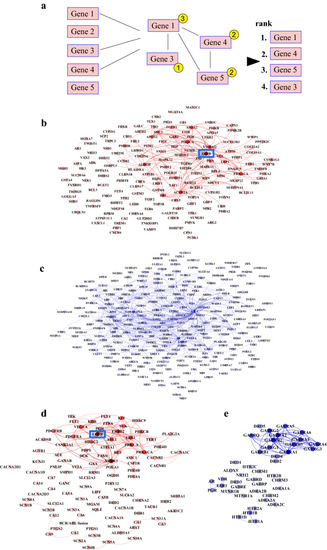
Protein–protein interaction analyses of significant hits from shRNA and drug library screens. (a) Schematic outline of the protein–protein interaction analysis. Significant gene or protein target hits from the screens were selected and number of their mutual interactions were calculated (depicted in yellow circles). Targets were subsequently ranked according to the number of their respective interactions. The lists were generated separately for down- and upregulated targets. (be) Significant hits from the screens were analyzed for their mutual interactions based on experimentally validated protein interaction information. Color of each node is scaled according to the quantity of interactions and color of each line corresponds to the node it originates from. (b) Genes down-regulated by shRNAs enriched by hypoxia-reoxygenation compared to normoxic controls. (c) Genes down-regulated by shRNAs depleted by hypoxia-reoxygenation compared to normoxic controls. (d) Protein targets of antagonistic drugs enhancing survival in hypoxia-reoxygenation. (e) Protein targets of agonistic drugs enhancing survival in hypoxia-reoxygenation. EGFR is highlighted with a blue rectangle.

Expression Data

Expression Detail
Antibody Labeling
Phenotype Data

Phenotype Detail
Acknowledgments
This image is the copyrighted work of the attributed author or publisher, and ZFIN has permission only to display this image to its users. Additional permissions should be obtained from the applicable author or publisher of the image. Full text @ Sci. Rep.