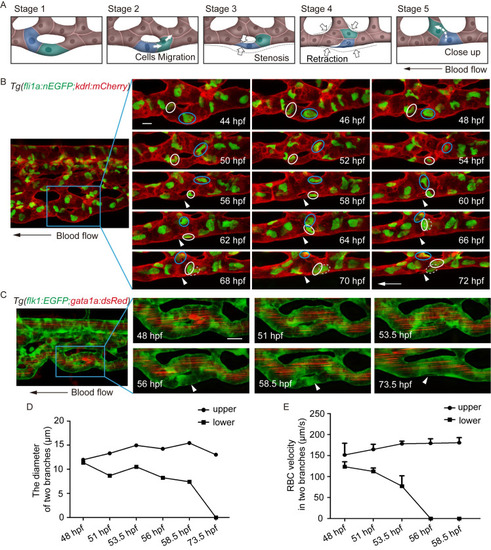
(A) Sketch map of EC rearrangement during vessel pruning. (B) Time-lapse live imaging of Tg(fli1a:nEGFP;kdrl:mCherry) embryos shows EC nucleus migration in CV pruning. Arrowheads indicate the pruned vessel. The arrows indicate the direction of the blood flow. Colored circles indicate ECs nuclei. 24 time-lapse live imaging were taken. Scale bar: 10 μm. (C) Time-lapse live imaging of Tg(flk1:EGFP;gata1a:dsRed) embryos shows vessel stenosis and the change of blood flow in CV pruning. Arrowheads indicate the lack of blood flow in the regressing vessel. The arrow indicates the direction of the blood flow. 10 time-lapse live imaging were taken. Scale bar: 10 μm. (D) The diameters of two branches at the indicated stages. (E) The velocity of RBCs in two branches at the indicated stages (48 hpf: S1 Video, 51 hpf: S2 Video, 53.5 hpf: S3 Video, 56 hpf: S4 Video, 58.5 hpf: S5 Video). The number of RBCs is calculated for blood flow at each stage: upper branch, 48.5 hpf: n = 5, 51 hpf: n = 10, 53.5 hpf: n = 8, 56 hpf: n = 9, 58.5 hpf: n = 10; lower branch, 48.5 hpf: n = 10, 51 hpf: n = 9, 53.5 hpf: n = 2.
|
