
Figure 6
- ID
- ZDB-FIG-210623-44
- Publication
- Liu et al., 2021 - In vivo calcium imaging reveals disordered interictal network dynamics in epileptic stxbp1b zebrafish
- Other Figures
- All Figure Page
- Back to All Figure Page
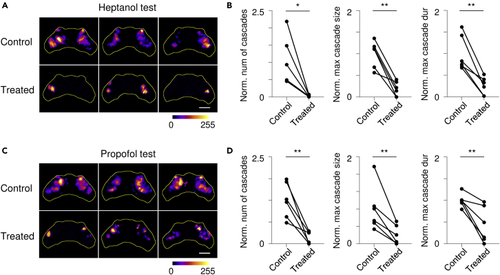
Gap junction blockers reduce neuronal cascade intensity (A) Representative stack summation of binary time series from (B) Comparison of normalized (norm.) number (num) of cascade, maximum (max) cascade size, and maximum cascade duration (dur) before and after heptanol treatment. Data were normalized to the average value from recordings before drug treatment. (C and D) Results from propofol experiments on |
| Fish: | |
|---|---|
| Conditions: | |
| Observed In: | |
| Stage Range: | Day 5 to Days 7-13 |