FIGURE

Figure 3

ID
ZDB-FIG-210623-41
Publication
Liu et al., 2021 - In vivo calcium imaging reveals disordered interictal network dynamics in epileptic stxbp1b zebrafish
Other Figures
All Figure Page
Back to All Figure Page
Figure 3

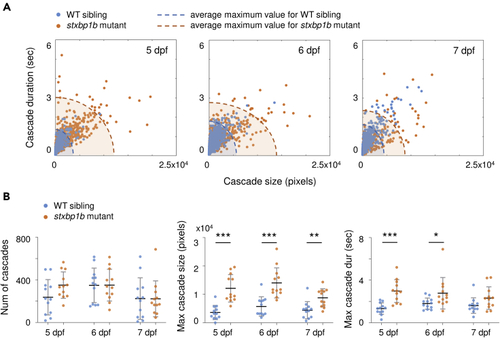
Cascade quantification

(A) Cascade size versus duration on different days post fertilization (dpf). Blue dots represent WT siblings, and orange dots represent stxbp1b mutants. Dashed lines are the ellipse contour of the average maximum value of cascade size and duration (blue, WT siblings; orange, stxbp1b mutants). For WT siblings, n = 2843, 4188, and 2690 cascades on 5, 6, and 7 dpf, respectively. For stxbp1b mutants, n = 4212, 4214, and 2668 cascades on 5, 6, and 7 dpf, respectively. Data from 12 fish per day for each condition is plotted.

(B) Probability distribution of cascade sizes on different dpf. The plots show the cumulative distributions of the corresponding data (blue, WT siblings; orange, stxbp1b mutants) on different dpf. Measurement of the number of cascade, maximum cascade size, and maximum cascade duration (per 5 min recording) on different dpf is shown. n = 12 fish per day for each condition. Data are represented as mean ± SD. Statistical significance is indicated as p < 0.05, ∗∗p < 0.01, ∗∗∗p < 0.001; Student's t test.

Expression Data

Expression Detail
Antibody Labeling
Phenotype Data
Fish:
Observed In:
Stage Range: Day 5 to Days 7-13

Phenotype Detail
Acknowledgments
This image is the copyrighted work of the attributed author or publisher, and ZFIN has permission only to display this image to its users. Additional permissions should be obtained from the applicable author or publisher of the image. Full text @ iScience