
Figure 2
- ID
- ZDB-FIG-210623-40
- Publication
- Liu et al., 2021 - In vivo calcium imaging reveals disordered interictal network dynamics in epileptic stxbp1b zebrafish
- Other Figures
- All Figure Page
- Back to All Figure Page
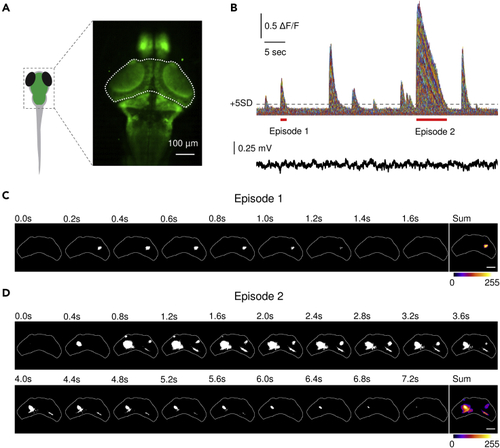
Measuring cascades in zebrafish optic tectum (A) Calcium imaging in (B) Calcium traces (ΔF/F) from pixels within the optic tectum in a (C and D) Binarized activity from episodes indicated in (B) (underlined in red). One normal cascade was revealed in (C), and multiple cascades were revealed in (D), including an abnormally large and long cascade located in the left optic tectum. The last frame represents the summation of the binary time series stack of the corresponding episode showing the spatial mapping of the cascades. The cumulative intensity of activation is color coded as shown in the color bar. Scale bars, 100 μm. |
| Fish: | |
|---|---|
| Observed In: | |
| Stage: | Day 6 |