|
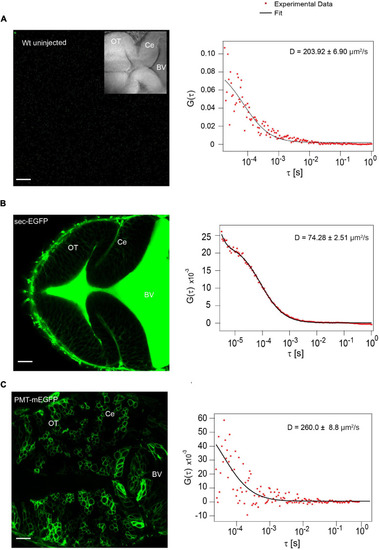
Secretion of positive and negative control in the BV (A) Auto fluorescence signal from wild type (Wt) unlabeled zebrafish embryo and representative autocorrelation function (ACF; dots) and fit (line) of a FCS measurement in the BV at ∼48 hpf.). (B) Expression of sec-EGFP in the zebrafish brain at ∼48hpf (left) and a representative autocorrelation function (ACF; dots) and fit (line) of a FCS measurement in the BV (right). (C) Expression of PMT-mEGFP in the zebrafish brain at ∼48 hpf (left) and a representative autocorrelation function (ACF; dots) and fit (line) of a FCS measurement in the BV of zebrafish (right). The FCS curves were fitted using 3D-2particle-1triplet model. BV, fourth brain ventricle; Ce, cerebellum; OT, optic tectum. Orientation: anterior to the left. Scale bar 20 μm.
|