|
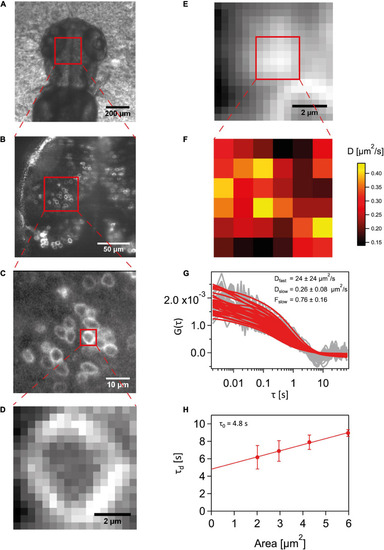
Schematic for a SPIM-FCS experiment. (A) A stereomicroscope image of the dorsal region of a 2-3 dpf Wnt3-EGFP expressing embryo. (B) sCMOS camera image capturing a large field of view of Wnt3-EGFP expressing cells at the midbrain-anterior hind brain region. (C) EMCCD camera image of a smaller subregion expressing Wnt3-EGFP fluorescent cells. (D) Cropped detector region of the imaging area with only a single cell in view. (E) A summed-up intensity projection of the 100,000 frames imaging the apical membrane of the cell imaged in (D). (F) A 6 6 subregion’s slow component diffusion coefficient map obtained from the fit values of the ACFs. (G) The raw autocorrelation data in gray and their corresponding fits in red. (H) Diffusion law plot for the 6 6 region to obtain the τ0 intercept value.
|