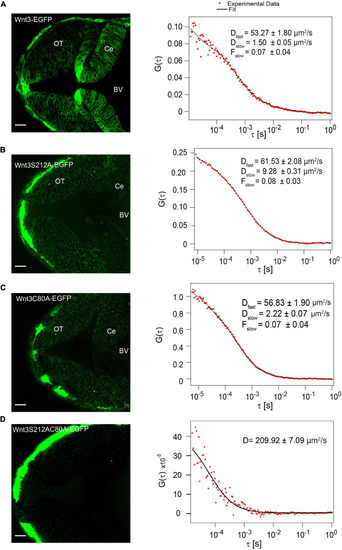
Influence of C80 and S212 lipidation on secretion in vivo. (A) Expression of Wnt3-EGFP in the zebrafish brain at ∼48 hpf (left) and a representative autocorrelation function (ACF; dots) and fit (line) of a Wnt3-EGFP FCS measurement in the BV (right). (B) Expression of Wnt3S212A-EGFP in the zebrafish brain at ∼48 hpf (left) and a representative autocorrelation function (ACF; dots) and fit (line) of Wnt3S212A-EGFP FCS measurement in BV (right). (C) Expression of Wnt3C80A-EGFP in the zebrafish brain at ∼48 hpf (left) and a representative autocorrelation function (ACF; dots) and fit (line) of a Wnt3C80A-EGFP FCS measurement in the BV (right). (D) Expression of Wnt3S212AC80A-EGFP in the zebrafish brain at ∼48 hpf (left) and a representative autocorrelation function (ACF; dots) and fit (line) of Wnt3S212AC80A-EGFP FCS measurement in BV (right). The FCS curves were fitted using 3D-2particle-1triplet model. BV, fourth brain ventricle; Ce, cerebellum; OT, optic tectum. Orientation: anterior to the left. Scale bar 20 μm.
|
