IMAGE

FIGURE 3

ID
ZDB-IMAGE-210617-35
Source
Figures for Dhasmana et al., 2021
Image
Figure Caption

FIGURE 3

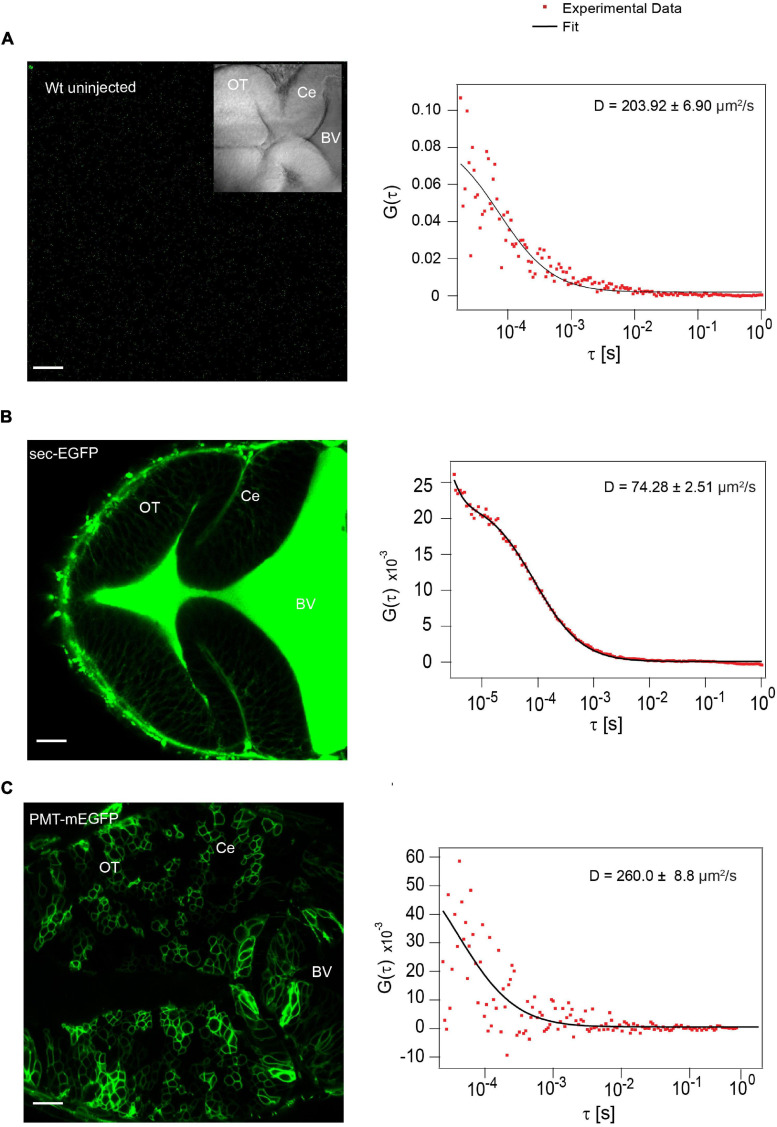
Secretion of positive and negative control in the BV (A) Auto fluorescence signal from wild type (Wt) unlabeled zebrafish embryo and representative autocorrelation function (ACF; dots) and fit (line) of a FCS measurement in the BV at ∼48 hpf.). (B) Expression of sec-EGFP in the zebrafish brain at ∼48hpf (left) and a representative autocorrelation function (ACF; dots) and fit (line) of a FCS measurement in the BV (right). (C) Expression of PMT-mEGFP in the zebrafish brain at ∼48 hpf (left) and a representative autocorrelation function (ACF; dots) and fit (line) of a FCS measurement in the BV of zebrafish (right). The FCS curves were fitted using 3D-2particle-1triplet model. BV, fourth brain ventricle; Ce, cerebellum; OT, optic tectum. Orientation: anterior to the left. Scale bar 20 μm.

Acknowledgments
This image is the copyrighted work of the attributed author or publisher, and ZFIN has permission only to display this image to its users. Additional permissions should be obtained from the applicable author or publisher of the image. Full text @ Front Cell Dev Biol