|
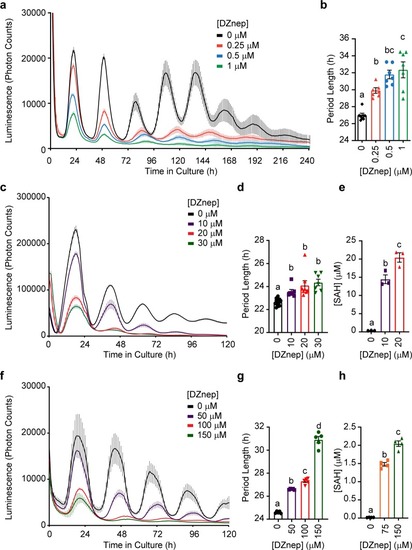
Biological rhythms are a quantitative gauge for methylation deficiency in plants and algae.a Mean luminescence ± SEM of Arabidopsis thaliana CCA1pro:LUC protoplasts treated with different concentration of DZnep, n = 8 wells per treatment. For comparison between different runs, traces were aligned in relation to the first peak; b shows mean ± SEM of period, n = 8 wells. c Mean luminescence ± SEM of CCA1-LUC Ostreococcus tauri cells, n = 7 wells; d shows mean ± SEM of period, n = 7 wells. No significance was observed between 10, 20 and 30 μM, but the significance compared to 0 μM became stronger, i.e., p < 0.05, p < 0.001, p < 0.0001, respectively, indicating dose-dependent effects. e Mean SAH concentration ± SEM in O. tauri treated with the indicated concentrations of DZnep, n = 3 wells. f Mean luminescence ± SEM of tufA-lucCP Chlamydomonas reinhardtii CBR cells treated with DZnep, n = 5 wells per treatment; g shows mean ± SEM of period, n = 5 wells. h Mean SAH concentration ± SEM in C. reinhardtii treated with the indicated concentrations of DZnep, n = 4 wells. All bar graphs analyzed by One-Way ANOVA (all p < 0.0001) followed by Bonferroni’s test; all indicated comparisons (a vs. b vs. c vs. d) at least p < 0.05. See also Supplementary Fig. 5.
|