FIGURE SUMMARY
Title

Methylation deficiency disrupts biological rhythms from bacteria to humans

Authors
Fustin, J.M., Ye, S., Rakers, C., Kaneko, K., Fukumoto, K., Yamano, M., Versteven, M., Grünewald, E., Cargill, S.J., Tamai, T.K., Xu, Y., Jabbur, M.L., Kojima, R., Lamberti, M.L., Yoshioka-Kobayashi, K., Whitmore, D., Tammam, S., Howell, P.L., Kageyama, R., Matsuo, T., Stanewsky, R., Golombek, D.A., Johnson, C.H., Kakeya, H., van Ooijen, G., Okamura, H.
Source
Full text @ Commun Biol

Adenosylhomocysteinase is a highly conserved protein.

a Structural superposition of AHCY from the 9 organisms investigated here, using human (1LI4), mouse (5AXA) or lupin (3OND) crystal structures as templates. The blue loop is specific to plants and green algae; DZnep is shown in yellow, NAD+ in black. See also Supplementary Movie 1. b Docking simulation of human AHCY with DZnep, based on the 1LI4 crystal structure of human AHCY complexed with Neplanocin A, an analog of DZnep. The amino acids involved in DZnep binding are indicated with their position. See Supplementary Fig. 2 for docking simulations of DZnep to AHCY from other organisms. Red and green arrows are hydrogen bonds, yellow spheres are hydrophobic effects. The estimated free energy of binding for depicted DZnep docking conformation was −9.87 kcal/mol. c Discontinuous alignment of amino acids contributing to the binding of DZnep, using the human sequence as a reference and with sequence identities shown on the right. When amino acids are identical to human, a dot is shown in the alignment. The sequence logo on top is a graphical representation of the conservation of amino acids, with the consensus symbols below (* = fully conserved residue, : = conservation of strongly similar properties, . = conservation of weakly similar properties). The positions of selected conserved amino acids are given for the human sequence on top of the alignment. d Molecular docking simulations of AHCY with adenosine and DZnep showing comparable binding free energies in all organisms. Colors represent full sequence identities, relative to human.

Circadian rhythms are a quantitative gauge for methylation deficiency in Metazoa.

a Mean luminescence ± SEM of human Bmal1-luc U-2 OS cells25 treated with increasing concentrations of DZnep; b shows mean ± SEM of period, n = 3 dishes. c Mean luminescence ± SEM of PER2::LUC MEF24 treated with DZnep, n = 3 dishes; mean ± SEM of period shown in d. e Mean luminescence ± SEM of Per1b-luciferase PAC-2 zebrafish cells treated with DZnep, n = 4 dishes; mean ± SEM of period shown in f; note the initial 96 h of data performed under light/dark cycles. g Mean luminescence ± SEM of ptim-TIM-LUC Drosophila halteres treated with DZnep, n = 8 independent halteres, with only the upper segment of the error bars shown for clarity; mean ± SEM of period shown in h. All bar graphs analyzed by One-Way ANOVA followed by Bonferroni’s test; all indicated comparisons (a vs. b vs. c vs. d vs. e), at least p < 0.05.

Biological rhythms are a quantitative gauge for methylation deficiency in plants and algae.

a Mean luminescence ± SEM of Arabidopsis thaliana CCA1pro:LUC protoplasts treated with different concentration of DZnep, n = 8 wells per treatment. For comparison between different runs, traces were aligned in relation to the first peak; b shows mean ± SEM of period, n = 8 wells. c Mean luminescence ± SEM of CCA1-LUC Ostreococcus tauri cells, n = 7 wells; d shows mean ± SEM of period, n = 7 wells. No significance was observed between 10, 20 and 30 μM, but the significance compared to 0 μM became stronger, i.e., p < 0.05, p < 0.001, p < 0.0001, respectively, indicating dose-dependent effects. e Mean SAH concentration ± SEM in O. tauri treated with the indicated concentrations of DZnep, n = 3 wells. f Mean luminescence ± SEM of tufA-lucCP Chlamydomonas reinhardtii CBR cells treated with DZnep, n = 5 wells per treatment; g shows mean ± SEM of period, n = 5 wells. h Mean SAH concentration ± SEM in C. reinhardtii treated with the indicated concentrations of DZnep, n = 4 wells. All bar graphs analyzed by One-Way ANOVA (all p < 0.0001) followed by Bonferroni’s test; all indicated comparisons (a vs. b vs. c vs. d) at least p < 0.05. See also Supplementary Fig. 5.

Cyanobacteria are less sensitive to AHCY inhibition.

a Mean luminescence ± SEM of Synechococcus PCC 7942 kaiBCp::luxAB knock-in strain treated with different concentrations of DZnep, n = 3 colonies, with only the upper section of the error bars and higher DZnep concentrations shown on a different graph for clarity; b shows mean period ± SEM, n = 3 colonies. c Mean luminescence ± SEM of Synechococcus PCC 7942 kaiBCp::luxAB treated with different Sinefungin concentrations as indicated over the graphs; d shows mean period ± SEM, n = 3 colonies. e Organization of the methyl cycle, with the two-steps SAH conversion to homocysteine in bacteria, starting with MTAN. One arrow represents one enzyme, except for methyltransferases that all use SAM as a co-substrate to methylate different targets, generating SAH in the process. The enzyme AHCY, mediating SAH hydrolysis and inhibited by DZnep, is indicated on the picture. All bar graphs analyzed by One-Way ANOVA followed by Bonferroni’s test; all indicated comparisons (a vs. b vs. c vs. d) at least p < 0.05.

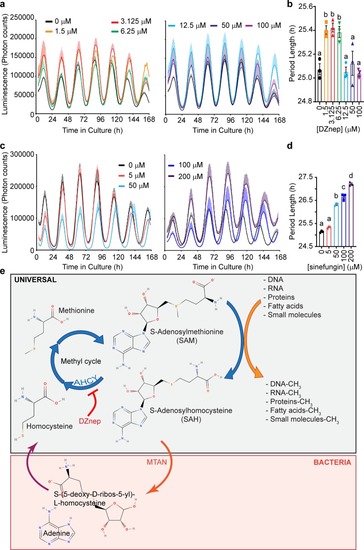
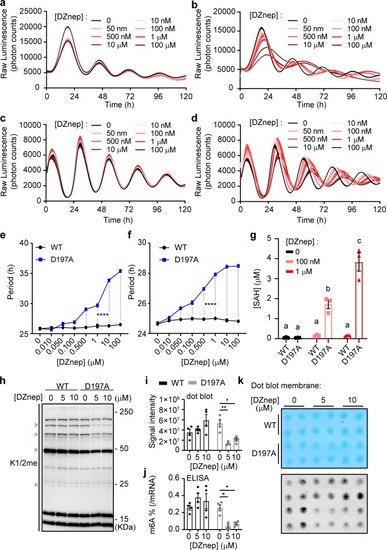
Rewiring the methyl cycle protects mammalian cells from methylation deficiency.

a, b Mean luminescence ± SEM of human Bmal1-luc U-2 OS cells transfected with WT and mutant MTAN, respectively, and treated with different concentrations of DZnep, n = 3 dishes per treatment. c, d Mean luminescence ± SEM of PER2::LUC MEFs transfected with WT and mutant MTAN, respectively, and treated with different concentrations of DZnep, n = 3 dishes per treatment. e, f Mean period ± SEM of Bmal1-luc U-2 OS cells and PER2::LUC MEFs from a, b and c, d, respectively, analyzed by two-way ANOVA followed by Bonferroni’s test, n = 3 dishes per treatment. The gray bars indicate which comparisons reach significance, all p < 0.0001 (****). g Mean SAH concentration ± SEM in DZnep-treated PER2::LUC MEFs, n = 3 dishes per treatment, analyzed by Two-Way ANOVA (all sources of variations p < 0.0001) followed by Bonferroni’s test; all indicated comparisons (a vs. b vs. c) at least p < 0.05. See also Supplementary Fig. 6. h Immunoblots using an antibody against mono- and di- methylated lysine (K1/2me) reveal that the methylation of some proteins is inhibited by DZnep, and rescued by WT but not D197A MTAN. The red > signs indicate such proteins. Actin loading control is shown in Supplementary Fig. 6i. i, j Mean mRNA m6A methylation levels ± SEM in PER2::LUC MEFs transfected with WT or D197A MTAN, then treated with DZnep for 48 h; i, j showing dot blot assay and enzyme-linked immunosorbent assay-based quantification (ELISA), respectively. Dot blot and ELISA analyzed separately by Two-Way ANOVA (DZnep treatment, MTAN effect and interactions at least p < 0.05) followed by Bonferroni’s test (*p < 0.05; **p < 0.01), n = 4 dishes. k Dot blot membrane quantified in i, with 150 ng mRNA/dot, first stained with methylene blue (top) as a loading control.

Acknowledgments
This image is the copyrighted work of the attributed author or publisher, and ZFIN has permission only to display this image to its users. Additional permissions should be obtained from the applicable author or publisher of the image. Full text @ Commun Biol