
Figure 3
- ID
- ZDB-FIG-210503-88
- Publication
- Avitan et al., 2021 - Spontaneous and evoked activity patterns diverge over development
- Other Figures
- All Figure Page
- Back to All Figure Page
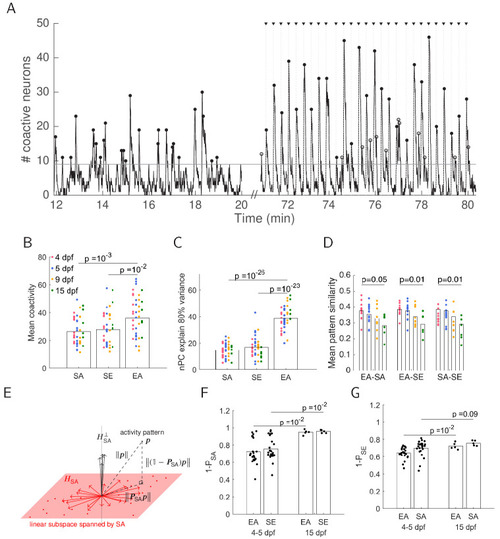
(A) Example showing the number of coactive neurons during 8 min of spontaneous activity in the dark and then during three cycles of stimulus presentation (stimulus onset is marked by black triangles). Significant peaks of coactivity levels (p<0.05, shuffled SA) during SA, EA (black dots), SE (open circles) are marked. (B) There are higher levels of mean coactivity during EA compared to SE and SA (one-way ANOVA, Bonferroni multiple comparison correction). (C) Number of principal components required to explain 80% of the variance (one-way ANOVA, Bonferroni multiple comparison correction) indicates higher dimensionality for evoked responses. In addition to the comparison shown, the dimensionality within the EA epoch increased over development; 4 (dpf) vs. 15 dpf p=0.05, one-way ANOVA, Bonferroni multiple comparison correction. (D) Pattern similarity decreased between all pairs of epochs over development. Similarity was defined as the cosine similarity between the different epochs. (E) Schematic of activity patterns geometry. The patterns of a particular epoch, in this example SA patterns, were collected (red dots), and a linear subspace spanned by these patterns was calculated (HSA, red plane; in reality this is of higher dimension than 2). Given a particular activity pattern 𝒑 (from a different epoch, in this example EA or SE) , 𝑷SA𝒑 is the projection of the pattern onto the subspace HSA. This is the component of the pattern which can be explained by the space HSA, and in the case where the pattern 𝒑 fully resides within HSA, 𝑷SA𝒑=𝒑. Conversely, (𝟙−𝑷SA)𝒑 is the component of the pattern which cannot be explained by the space HSA. It is the projection of the pattern 𝒑 onto the orthogonal complement of the subspace spanned by SA, H1/SA. (F) Projection of EA and SE patterns onto the orthogonal complement subspace spanned by SA patterns indicates that EA and SE patterns are less similar to SA over development. (G) Projection of EA and SA patterns onto the orthogonal complement subspace spanned by SE patterns indicates that EA and SA patterns are less similar to SE over development. |