|
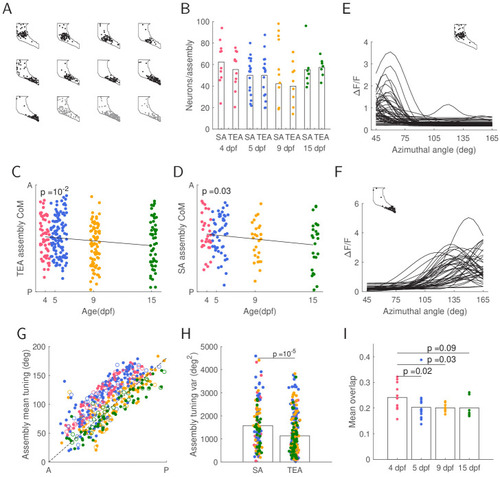
Stimulus driven and spontaneous recurring assemblies undergo similar global circuitry effects.(A) Nine total evoked activity (TEA) assemblies (black) and three spontaneous activity (SA) assemblies (gray) for the 15 dpf fish shown in Figure 1A. The outline shows the periventricular layer (PVL) within the field of view, with each dot representing a neuron. (B) Number of assembly neurons assigned to TEA or SA assemblies did not change over development (t-test 4 vs. 15 TEA p=0.5; SA p=0.8). (C-D) Centres of mass (CoMs) of assemblies within TEA or SA shifted posteriorly over development. Each column of points represents assembly CoMs for a single fish. E-F: Assembly neurons’ fitted tuning curves of the most anterior (E) and posterior (F) TEA assemblies from A (inset) illustrate tuning variability within the assembly. (G) Mean assembly tuning of TEA (filled circles) and SA (empty circles) assemblies shows a posterior shift in tuning with age. Dashed line represents the perfectly linear mapping. (H) Tuning variance is higher for SA assemblies than TEA assemblies (t-test), indicating that in general tuning of spontaneous assemblies is more dispersed than stimulus driven assemblies. I: Mean overlap between TEA and SA assemblies decreases between 4 and 5 dpf and remains stable over development.
|