
Figure 8—figure supplement 1.
- ID
- ZDB-FIG-210220-41
- Publication
- Fontenas et al., 2021 - Spinal cord precursors utilize neural crest cell mechanisms to generate hybrid peripheral myelinating glia
- Other Figures
-
- Figure 1
- Figure 1—figure supplement 1—source data 1.
- Figure 1—figure supplement 2—source data 1.
- Figure 1—figure supplement 3.
- Figure 2—figure supplement 1.
- Figure 2—figure supplement 1.
- Figure 3—figure supplement 1.
- Figure 3—figure supplement 1.
- Figure 3—figure supplement 2.
- Figure 4
- Figure 5—figure supplement 1—source data 1.
- Figure 5—figure supplement 1—source data 1.
- Figure 6—figure supplement 1.
- Figure 6—figure supplement 1.
- Figure 6—figure supplement 2.
- Figure 7—figure supplement 1.
- Figure 7—figure supplement 1.
- Figure 8—figure supplement 1.
- Figure 8—figure supplement 1.
- Figure 8—figure supplement 2—source data 1.
- All Figure Page
- Back to All Figure Page
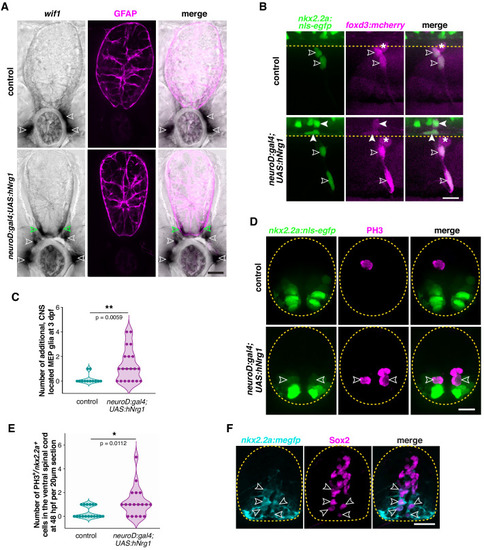
(A) In situ hybridization showing wif1+ MEP glia (white outlined arrowheads) along motor nerve roots in WT larvae (n = 30 larvae) at 3 dpf and both inside (green outlined arrowheads) and outside (white outlined arrowheads) the spinal cord in neuroD:gal4;UAS:hNrg1 larvae (n = 30 larvae). Zrf1 immunostaining shows GFAP+ radial glia and denotes the outline of the spinal cord. (B) Lateral view of 3 dpf nkx2.2a:nls-egfp;foxd3:mcherry control and neuroD:gal4;UAS:hNrg1 larvae showing nkx2.2a+/foxd3+ MEP glia (outlined arrowheads) along motor nerve root axons. MEP glia are found in both the PNS (outlined arrowheads) and in the ventral spinal cord (arrowheads) in neuroD:gal4;UAS:hNrg1 larvae. Asterisks denote the DRG. (C) Mean ± SEM of additional, centrally located MEP glia per hemi-segment in control (0.17 ± 0.11; n = 12 larvae) and neuroD:gal4;UAS:hNrg1 larvae (1.3 ± 0.3; n = 20 larvae) at 3 dpf. (D) PH3 immunostaining on spinal cord transverse sections in neuroD:gal4;nkx2.2a:nls-egfp control larvae and neuroD:gal4;UAS:hNrg1;nkx2.2a:nls-egfp larvae showing PH3+/nkx2.2a+ proliferating radial glia (outline arrowheads). (E) Mean ± SEM of PH3+/nkx2.2a+ cells in the ventral spinal cord per 20 µm section in neuroD:gal4 (0.35 ± 0.12; n = 17 sections from four embryos) and neuroD:gal4;UAS:hNrg1 larvae (1.22 ± 0.3; n = 18 sections from four embryos). (F) Transverse section of a nkx2.2a:megfp larva at 4 dpf showing Sox2+/nkx2.2a+ radial glial precursors. Yellow dashed lines denote the edge of the spinal cord. Scale bar (A,B,D,F), 10 µm. |