
FIGURE
Figure 2—figure supplement 1.
- ID
- ZDB-FIG-210220-29
- Publication
- Fontenas et al., 2021 - Spinal cord precursors utilize neural crest cell mechanisms to generate hybrid peripheral myelinating glia
- Other Figures
-
- Figure 1
- Figure 1—figure supplement 1—source data 1.
- Figure 1—figure supplement 2—source data 1.
- Figure 1—figure supplement 3.
- Figure 2—figure supplement 1.
- Figure 2—figure supplement 1.
- Figure 3—figure supplement 1.
- Figure 3—figure supplement 1.
- Figure 3—figure supplement 2.
- Figure 4
- Figure 5—figure supplement 1—source data 1.
- Figure 5—figure supplement 1—source data 1.
- Figure 6—figure supplement 1.
- Figure 6—figure supplement 1.
- Figure 6—figure supplement 2.
- Figure 7—figure supplement 1.
- Figure 7—figure supplement 1.
- Figure 8—figure supplement 1.
- Figure 8—figure supplement 1.
- Figure 8—figure supplement 2—source data 1.
- All Figure Page
- Back to All Figure Page
Figure 2—figure supplement 1.
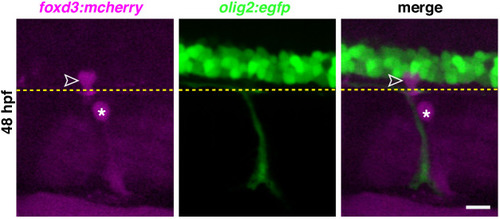
Yellow dashed lines denote the edge of the spinal cord and asterisks denote the DRG. Scale bar, 10 µm. |
Expression Data
Expression Detail
Antibody Labeling
Phenotype Data
Phenotype Detail
Acknowledgments
This image is the copyrighted work of the attributed author or publisher, and
ZFIN has permission only to display this image to its users.
Additional permissions should be obtained from the applicable author or publisher of the image.
Full text @ Elife