
Figure 1
- ID
- ZDB-FIG-210220-24
- Publication
- Fontenas et al., 2021 - Spinal cord precursors utilize neural crest cell mechanisms to generate hybrid peripheral myelinating glia
- Other Figures
-
- Figure 1
- Figure 1—figure supplement 1—source data 1.
- Figure 1—figure supplement 2—source data 1.
- Figure 1—figure supplement 3.
- Figure 2—figure supplement 1.
- Figure 2—figure supplement 1.
- Figure 3—figure supplement 1.
- Figure 3—figure supplement 1.
- Figure 3—figure supplement 2.
- Figure 4
- Figure 5—figure supplement 1—source data 1.
- Figure 5—figure supplement 1—source data 1.
- Figure 6—figure supplement 1.
- Figure 6—figure supplement 1.
- Figure 6—figure supplement 2.
- Figure 7—figure supplement 1.
- Figure 7—figure supplement 1.
- Figure 8—figure supplement 1.
- Figure 8—figure supplement 1.
- Figure 8—figure supplement 2—source data 1.
- All Figure Page
- Back to All Figure Page
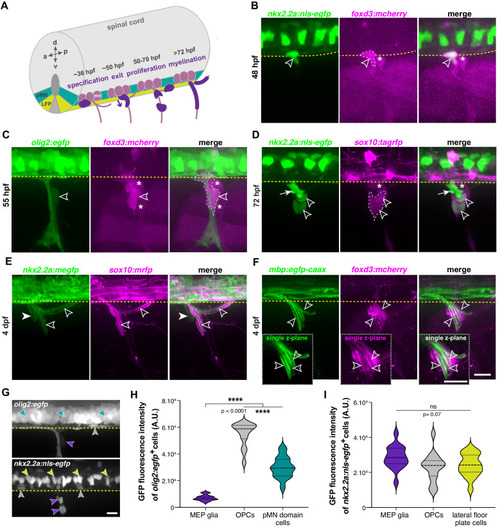
(A) Timeline of MEP glial development. MEP glia (purple) are specified in the ventral spinal cord (gray) after 36 hpf, exit through motor exit points at ~50 hpf, divide, and migrate to eventually initiate myelination of motor root axons (pink) starting at 72 hpf. mn: motorneuron, LFP: lateral floor plate. (B–F) Lateral views of the motor exit point showing (B) a nkx2.2a+/foxd3+ MEP glia (outlined arrowhead) exiting the spinal cord at the motor exit point at 48 hr post-fertilization (hpf); (C) an olig2+/foxd3+ MEP glia (outlined arrowhead) along motor nerve root axons at 55 hpf; (D) sox10+/nkx2.2a+ MEP glia (outlined arrowheads) and sox10-/nkx2.2a+ perineurial glia (arrow) at 72 hpf; (E) sox10+/nkx2.2a- MEP glial sheaths (outlined arrowheads) and sox10+/nkx2.2a+ perineurial cells at 4 days post-fertilization dp (arrowhead) and (F) foxd3+ MEP glia making mbp+ myelin sheaths (outlined arrowheads) at 4 dpf. Insets show single z-plane images. (G) In olig2:egfp and nkx2.2a:nls-egfp larvae at 55 hpf, olig2+ pMN domain cells (teal), OPCs (gray), and MEP glia (purple) are labeled, as are nkx2.2a+ LFP cells (yellow), OPCs (gray) and MEP glia (purple). These images were used for fluorescence intensity measurement. (H) Violin plot of mean intensity of GFP fluorescence of olig2:egfp+ cells at 55 hpf (OPCs: 54914 ± 1674 arbitrary units (A.U.), MEP glia: 7149 ± 394, pMN domain cells: 29934 ± 1481). (I) Violin plot of mean intensity of GFP fluorescence of nkx2.2a:nls- egfp cells at 55 hpf (OPCs: 22981 ± 2013, MEP glia: 28610 ± 1624, lateral floor plate cells: 24049 ± 1602). (H–I) (n = 28 MEP glia, n = 28 OPCs and n = 28 neural tube cells from seven embryos). Asterisks denote the dorsal root ganglion (DRG) and yellow dashed lines denote the edge of the spinal cord. Scale bar (B–G) 20 µm. |