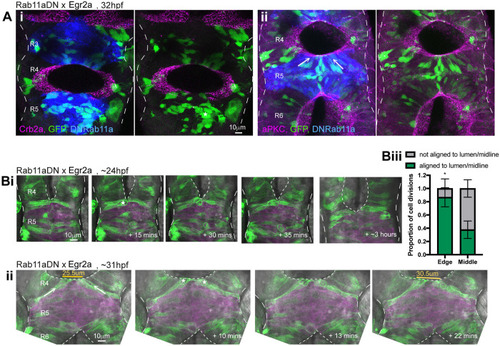
Cells at the wild-type/DNRab11a interface contribute to the luminal surface. (A) 15-18 µm maximum projections through 32 hpf DNRab11a × Egr2a embryo hindbrains stained for Crb2a (Ai) or aPKC (Aii). Cells were mosaically labelled with cytoplasmic GFP and H2A-GFP. (Ai) Crb2a is largely absent from DNRab11a cells (blue) contacting the lumen (five of five embryos). (Aii) aPKC is present at the lumen in both wild-type and DNRab11a cells (blue) (four of four embryos). Cells in the centre of DNRab11a rhombomeres (R) clumped together (e.g. star in Ai), whereas cells in contact with the open lumens had elongated morphology (e.g. arrows in Aii). (B) Single dorsal view z-slices from time-lapse movie of neuroepithelial cells in rhombomere 5 of a 24 hpf DNRab11a × Egr2a embryo. Long-dashed lines denote basal surfaces. Short-dashed lines denote apical surfaces. (Bi) As the neighbouring lumen inflated, cells at the edge of the DNRab11a rhombomere remained connected across the midline, and cells near the edge divided at this central point of connection with parallel orientation (star). (Bii) As the neighbouring lumen inflated further, cells near the wild-type/DNRab11a interface reoriented towards the open lumen (e.g. arrows). Cells divided at the opening luminal surface with parallel orientation (stars). This widened the DNRab11a luminal surface further (see measurements in orange). (Biii) Quantification of cell division orientation. One hundred and four DNRab11a cell divisions were analysed from three embryos over the 24-40 hpf period of development. Eighty-seven per cent of DNRab11a cells dividing at the luminal edge did so parallel to the opening lumen, whereas 38% of DNRab11a cells dividing in the middle of rhombomeres 3 and 5 did so parallel to the midline (P=0.0121, Student's unpaired, two-tailed t-test). Error bars denote standard deviations between embryos.
|
