Mpp5a-dependent transition from spot adhesion to apical ring. (A) Diagram of neural rod with inserted red sheet to illustrate sagittal plane of confocal sections. Red arrow indicates direction of imaging. (B) Sagittal confocal planes of neural rod in anterior spinal cord region at 11-, 13-, 15- and 17-somite stages (ss). Comparable images were seen at each time point from three embryos. Images in the bottom row are from fixed embryos stained for ZO-1. Comparable images were seen from two embryos at each time point. Red arrow indicates ventral apical rings and red arrowhead indicates puncta. Dorsal is at the top of each panel. (C) Sagittal confocal images at 12-somite stage showing that Pard3-EGFP puncta are often located at cell vertices (arrowheads, n=8 embryos). Plasma membrane was imaged using mNeptune2.5-CAAX (mNept-CX). (D) Examples of punctate Pard3-EGFP in developing apical rings from a 15-somite-stage embryo. Dorsal example shows an immature, incomplete ring. Ventral example shows a more complete ring, with arrows indicating multiple puncta between vertices. Single sagittal confocal planes. (E) A heat-map quantification of the formation of mature Pard3 apical rings from two embryos over developmental time and dorsoventral position. (F) Parasagittal confocal sections from left-hand side (LHS) and right-hand side (RHS) of 15-somite stage neural rod. Incomplete apical rings of Pard3-EGFP are forming independently on left and right sides of the midline. (G) Parasagittal and sagittal confocal sections at 17-somite stage showing complete apical rings of Pard3-EGFP on either side of the midline. The sagittal section (labelled Middle) shows a largely diffuse, low level of Pard3-EGFP expression in the midline territory between the left and right rings (see Movie 1). Apical ring formation in F,G was analysed from >10 embryos. For each embryo, 10-25 apical rings were located on one side of the neuroepithelium, and a z-stack was taken through the middle of the neural rod until the rings on the opposite side were visible. (H) Images taken from confocal time-lapse movies of wild-type (WT) and mpp5a morphant Pard3-EGFP embryos in sagittal orientation from the 16-somite stage to 24 hpf. Comparable images were obtained from three embryos from each genotype. Three control morphants were also assessed in the Cdh2-tFT transgenic line, and all had apical rings comparable to wild types.

Sister cells remain attached via their corners. (A) Images from time-lapse movie projection in dorsal orientation of mosaically labelled neuroepithelial cells in the hindbrain of an 11-somite-stage wild-type embryo. Membrane and nuclei are labelled in magenta. By the 13-somite stage, both cells had undergone C-division, resulting in pairs of sister cells attached across the tissue midline. The top cell pair was followed over time until the 18-somite neural rod stage, when both cell pairs were imaged. The configuration of cell pair connections was assessed from several different experiments at the neural rod stage (∼16-18 somites), and 26 of 31 pairs of cells from five embryos at neural rod stages were found clearly to be attached via their corners. The remaining five were either connected via a more ‘en face’ configuration or their configuration was uncertain (e.g. owing to a very thin connection point). (Bi) Single z-planes from a time-lapse movie of a C-division (yellow cell) starting at the 10-somite stage (neural keel), from a Cdh2-tFT transgenic embryo. The image contrast was increased in the reference image at the top to highlight that Cdh2 was concentrated at the interdigitation zone between cells around the tissue midline at 0 min. Cdh2-GFP becomes strongly concentrated in the cleavage furrow (time point 15 min), and neighbouring cells ingress into the cleavage furrow (21 of 21 divisions, red arrows). In this example, the pink cell that ingresses into the cleavage furrow gains a contralateral contact with the contralateral daughter of the C-division. As a result of this contact, the contralateral daughter (yellow cell on right) becomes attached to two contralateral cells; one is its sister cell from the C-division and the other is one of its sister's neighbouring cells (the pink cell in this example). (Bii) 5 µm projection of 17-somite stage neural rod from a Cdh2-tFT transgenic embryo. Endfeet are aligned along a centrally located midline. Cdh2-GFP is upregulated along the midline, particularly at cell corners (red arrowheads in magnified region). (Biii) Model depicting the co-ingression of neighbouring cells into the cleavage furrow during C-division (yellow cells) and the subsequent offsetting of sister cells from each other, which precedes apical ring formation, based on images similar to those in Bi. Red lines and dots represent high levels of Cdh2 associated with the dividing cell. The ingression of either ipsilateral (e.g. orange) or contralateral (e.g. blue) neighbours into the cleavage furrow promotes the formation of multiple contralateral connections across the midline. For example, the left-hand yellow sister cell becomes attached to both its right-hand yellow sister cell and the ingressing blue cell. The right-hand yellow sister cell becomes attached to both its left-hand yellow sister cell and the ingressing orange cell. (Ci) Transmission electron micrographs of a 20 hpf embryo hindbrain in transverse orientation. The lumen has started to open from the midline. The interface between contralateral cells has a striking ‘zig-zag’ pattern (three of three 19-20 hpf embryos). (Cii) Inset magnified region from Ci.

Mpp5a-dependent remodelling of midline adhesions. (Ai) Images from confocal time-lapse movies of Pard3-EGFP and Cdh2-GFP embryos in horizontal orientation at 11-somite stage (ss), 17ss and 24 hpf stages. Comparable images were seen from three embryos from each transgenic line. (Aii,Aiii) Mean intensity profiles from six embryos, quantifying Pard3 intensity across the basal-to-basal width of the developing neuroepithelium over time, starting at the 16-somite stage. Standard deviation is shown as a grey ribbon around the line profile for each time point in Aiii. (Aiv) Mean intensity profiles from the same six embryos, quantifying Pard3 intensity across the basal-to-basal width of the neuroepithelium at the fully neuroepithelial stage. (Av) Horizontal confocal planes of 17-somite stage neural rod showing Pard3-EGFP expression at five different dorsoventral levels. The single elevated plane of expression at the left-right interface, seen at the level of 17 μm, lies dorsal to levels where apical rings are already formed and ventral to levels where expression is more prominent in mediolateral streaks. (Avi) Single horizontal plane confocal section of Pard3-EGFP and mNeptune2.5-CAAX and merge at ∼24 hpf. Plasma membranes meet at the tissue midline, and Pard3 is now largely located in two parallel parasagittal domains. (B) Horizontal and transverse confocal sections of 30 hpf. Wild-type (WT; Bi) and mpp5am227 mutant (Bii) Cdh2-GFP embryos at the hindbrain level. The hindbrain lumen remained closed in five of five mpp5am227 mutant embryos and is always open in wild types. (C) Horizontal confocal sections of wild-type (Ci) and mpp5am227 mutant (Cii) Cdh2-GFP embryos at the anterior spinal cord level, stained for Crb2a. Insets in the 18- and 26-somite stages of wild types show merged images of Crb2a and Cdh2-GFP expression. (Ci) In wild-type embryos, Cdh2 and Crb2a were colocalised at the midline at the 18-somite stage (four of four embryos), but Cdh2-GFP was displaced basolaterally to form two independent stripes of expression either side of the midline by the 26-somite stage (eight of eight embryos). In mpp5am227 mutants, Crb2a was not present at the midline at the 18-somite stage (four of four embryos), and Cdh2-GFP remained in a single expression domain at the tissue midline even as late as 28 hpf (five of five embryos).

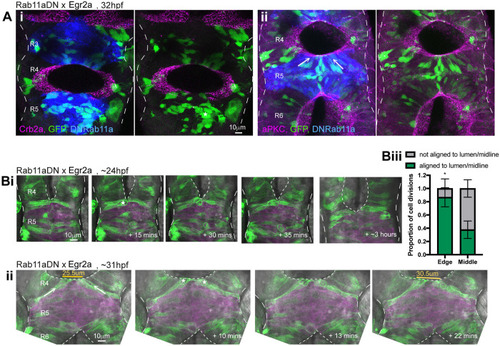
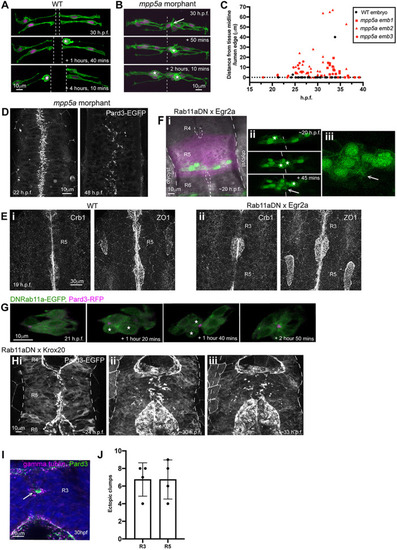
Persistent adhesion in Mpp5a- and Rab11a-deficient cells. (A) Images from time-lapse movie of mosaically labelled neuroepithelial cells in the hindbrain of a 30 hpf wild-type (WT) embryo, dorsal view. Cells have separated across the tissue midline and the lumen has opened (dashed lines). D-divisions (stars) occur at the apical surface, and cells re-established an elongated morphology towards the basal surface after division. (B) Images from time-lapse movie of mosaically labelled neuroepithelial cells in the hindbrain of a 30 hpf mpp5a morphant embryo, dorsal view. Cells have failed to separate across the tissue midline (dashed line) and have formed clumps (sometimes with a rosette-like structure; arrow). D-divisions (stars) occurred near the centre of the cell clumps, which was often not situated near the tissue midline. Of 117 daughter cells followed post-division, ≥40% did not re-extend fully to the basal side of the neural rod. (C) Graph of cell division locations in relationship to the tissue midline or lumen edge over development. Seventy-one cells were analysed from three mpp5a morphant embryos. In embryos >25 hpf, 49% of mpp5a morphant cells divided 5 µm or more away from the midline. Division locations from a single wild-type embryo example are included in black. (D) A 10 µm z-projection, dorsal view, at mid-dorsoventral level through the hindbrain of mpp5a morphant Pard3-EGFP embryos at 22 and 48 hpf. At 22 hpf, Pard3-EGFP was localised near the tissue midline but did not form continuous straight expression domains as seen in wild types (Fig. 3Ai), and the lumen failed to open. By 48 hpf, Pard3-EGFP localisation became fragmented into clumps. Nine of nine mpp5a mutant embryos and six of eight mpp5a morphant embryos >24 hpf old from five different experiments had fragmented midlines and ectopic apical proteins. The extent of this disorganisation was greater in older embryos. Two of six mpp5a morphant embryos had a milder phenotype (see Fig. S1). Nine of nine wild-type embryos had normal apical surfaces, with no ectopic apical proteins. (E) 70-80 µm maximum projections, dorsal view of hindbrain at 19 hpf, stained for Crb1 and ZO-1. (Ei) Wild-type embryo. Both Crb1 and ZO-1 were localised to the apical midline (n=3/3). (Eii) Embryo in which UAS:DNRab11a was expressed under the Egr2a:KalTA4 activator in rhombomeres (R) 3 and 5. ZO-1 localised to the midline, but Crb1 was largely absent from rhombomeres 3 and 5 (n=3/3). (Fi) 11 µm maximum-intensity projection of dorsal view of hindbrain neuroepithelial cells at 20 hpf in a DNRab11a × Egr2a embryo. Magenta shows DNRab11a rhombomere 5. Lumen in rhombomere 5 failed to open but had opened in rhombomeres 4 and 6 (short-dashed lines are lumen surface, long-dashed lines are basal surface). (Fii) Maximum-intensity projection images from time-lapse movie of cells in Fi, which failed to separate across the tissue midline (white dashes). Similar to mpp5a morphant embryos (B), after D-divisions (stars), cells remained attached and were arranged into a rosette-like structure (arrow), enlarged in Fiii. Cell clumping or rosette-like structures were observed in DNRab11a rhombomeres of all nine embryos analysed from three experiments. Note, in all panels in F we have edited out overlying cells from z-planes that would otherwise obscure the view of the cells participating in the rosette. Unedited versions of these images can be seen in Fig. S1. (G) Time-lapse reconstruction showing mosaically distributed DNRab11a-EGFP neuroepithelial cells in hindbrain of 24-somite-stage (21 hpf) embryo. After D-divisions (stars), cells did not separate and formed a rosette around centrally located puncta of Pard3-RFP. (H) 70 µm maximum projections from time-lapse movie through a DNRab11a × Egr2a embryo hindbrain labelled with Pard3-EGFP, starting at 24 hpf. As in mpp5a morphants in D, Pard3 was initially close to the midline of rhombomere 5, but the lumen failed to open and Pard3 localisation became fragmented into clumps that dispersed over time (17 of 17 embryos). (I) 4 µm maximum projection, dorsal view of 30 hpf DNRab11a × Egr2a embryo rhombomere 3, stained for Pard3 and gamma-tubulin. Pard3 is localised in a round clump, surrounded on all sides by centrosomes. (J) DNRab11a rhombomeres 3 and 5 had approximately seven ectopic clumps of Pard3 and gamma-tubulin at 30 hpf (n=4 embryos). Error bars denote standard deviations. No ectopic clumps were seen in wild-type rhombomeres.

Cells at the wild-type/DNRab11a interface contribute to the luminal surface. (A) 15-18 µm maximum projections through 32 hpf DNRab11a × Egr2a embryo hindbrains stained for Crb2a (Ai) or aPKC (Aii). Cells were mosaically labelled with cytoplasmic GFP and H2A-GFP. (Ai) Crb2a is largely absent from DNRab11a cells (blue) contacting the lumen (five of five embryos). (Aii) aPKC is present at the lumen in both wild-type and DNRab11a cells (blue) (four of four embryos). Cells in the centre of DNRab11a rhombomeres (R) clumped together (e.g. star in Ai), whereas cells in contact with the open lumens had elongated morphology (e.g. arrows in Aii). (B) Single dorsal view z-slices from time-lapse movie of neuroepithelial cells in rhombomere 5 of a 24 hpf DNRab11a × Egr2a embryo. Long-dashed lines denote basal surfaces. Short-dashed lines denote apical surfaces. (Bi) As the neighbouring lumen inflated, cells at the edge of the DNRab11a rhombomere remained connected across the midline, and cells near the edge divided at this central point of connection with parallel orientation (star). (Bii) As the neighbouring lumen inflated further, cells near the wild-type/DNRab11a interface reoriented towards the open lumen (e.g. arrows). Cells divided at the opening luminal surface with parallel orientation (stars). This widened the DNRab11a luminal surface further (see measurements in orange). (Biii) Quantification of cell division orientation. One hundred and four DNRab11a cell divisions were analysed from three embryos over the 24-40 hpf period of development. Eighty-seven per cent of DNRab11a cells dividing at the luminal edge did so parallel to the opening lumen, whereas 38% of DNRab11a cells dividing in the middle of rhombomeres 3 and 5 did so parallel to the midline (P=0.0121, Student's unpaired, two-tailed t-test). Error bars denote standard deviations between embryos.

Mpp5a is necessary for apical ring formation even in the absence of cell division. All embryos are at the 28-somite stage. (A-D) Orthogonal series of horizontal (top left), transverse (top right) and sagittal (bottom) confocal planes of Pard-EGFP expression in the following embryos. (A) Wild-type sibling treated with DMSO vehicle control. Many small apical rings have formed at the tissue midline (n=3/3 embryos). (B) Wild-type sibling treated with aphidicolin to block the C-divisions. Fewer, large apical rings have formed at the tissue midline (n=4/4 embryos). (C) mpp5am227 mutant embryo treated with DMSO vehicle control. No apical rings have formed at the tissue midline. Pard3 is visible as spots along the midline plane (n=3/3 embryos). (D) mpp5am227 mutant embryo treated with aphidicolin to block C-divisions. No apical rings have formed at the tissue midline. Pard3 is visible as spots along the midline plane (n=4/4 embryos). (E) Overall body shape of wild-type siblings and mpp5am227 mutants with and without aphidicolin treatment. (F) Horizontal section through neural tube showing nuclear staining in wild-type embryos treated with DMSO or aphidicolin to block C-divisions. Aphidicolin-treated embryos have larger nuclei, demonstrating that S-phase division block was successful. (G) Quantification of the area of the nucleus of wild-type siblings and mpp5am227 mutants with and without aphidicolin treatment. Data from 100-150 nuclei were pooled from two or three embryos in each group and analysed by two-way ANOVA. Areas of aphidicolin-treated nuclei were, on average, 30 µm2 bigger than those of DMSO-treated embryos (P<0.0001). There was no significant difference in the area of nuclei between wild-type and mpp5am227 mutant embryos (P=0.8561). Error bars denote standard deviations. (H) Quantification of the number of apical rings in wild-type siblings and mpp5am227 mutants with and without aphidicolin treatment. Numbers of apical rings per 1000 µm2 were calculated from three or four embryos per group. No apical rings were seen in any of the mpp5am227 mutants. There were, on average, 40 fewer apical rings per 1000 µm2 in aphidicolin-treated wild-type embryos than in DMSO-treated wild-type embryos (Student's unpaired t-test, P=0.0222). Error bars denote standard deviations.

Acknowledgments
This image is the copyrighted work of the attributed author or publisher, and ZFIN has permission only to display this image to its users. Additional permissions should be obtained from the applicable author or publisher of the image. Full text @ Development