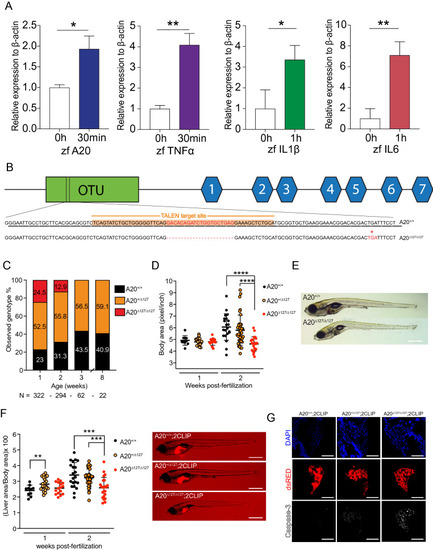
A20-deficient zebrafish fail to thrive. (A) Peak induction of inflammatory genes, and relative p-values. *P < 0.05, **P < 0.01. (B) Gene targeting of A20 highlighting the 20 bp deletion and predicted stop codon at amino acid 127, previously a Leucine. (C) Percentages of surviving A20+/+, A20+/∆127 and A20∆127/∆127 zebrafish at 1, 2, 3 and 8wpf, generated from N = 15 A20+/∆127 crosses. (D) Body area measured in (pixel/inch) per zebrafish genotype at 1 and 2 wpf. Each dot represents an individual zebrafish. Data represented as mean ± SD, P-values were determined using 1way ANOVA. ****P < 0.0001. Each group passed the normality test. (E) Representative brightfield image of one A20+/+ (top) and A20∆127/∆127 (bottom) zebrafish at 2 wpf. Scale bar represent 2 mm. (F) Liver to body ratios measured in (pixel/inch) per zebrafish genotype at 1 and 2 wpf. Each dot represents an individual zebrafish. Data represented as mean ± SD, P-values were determined using 1way ANOVA. **P < 0.01, ****P < 0.0001. Each group passed the normality test. For each genotype a representative A20+/+, A20+/∆127 and A20∆127/∆127 2 wpf zebrafish is shown. The scale bars represent 2 mm. (G) Immuno-fluorescence sections of livers from 2CLIP reporter fish for the A20 genotypes. The scale bars represent 300 μm. Software used for this Figure: GraphPad Prism v7.0 (https://www.graphpad.com/scientific-software/prism/), Adobe Illustrator CC 2018 (https://www.adobe.com/au/products/illustrator.html), Leica LAS X (https://www.leica-microsystems.com/products/microscope-software/p/leica-application-suite/), IMARIS Image Analysis Software v8 (BITPLANE, Switzerland) (https://imaris.oxinst.com/).
|
