|
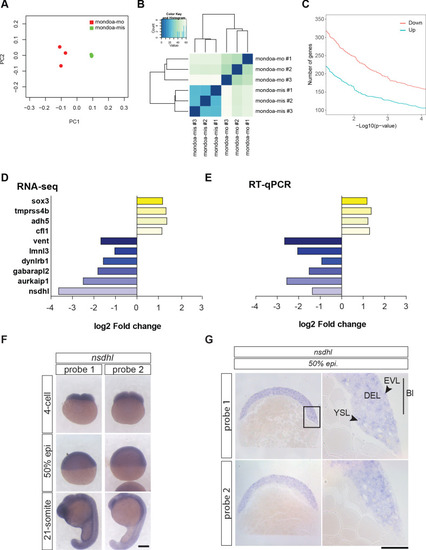
RNA-seq analysis of mondoa-mo <italic>vs.</italic>mondoa-mis injected embryos identifies nsdhl as a major MondoA target gene.(A) Principal component analysis (PCA) plot of the first two principal components (PC one and PC 2) to visualize the overall structure of the data. It resolves the two treatment groups mondoa-mo injected (red) and mondoa-mis injected (green), thereby revealing a clear alteration of the morphant transcriptome. Biological replicates cluster closely together in this analysis, indicating good reproducibility and absence of batch effects. (B) Heatmap visualizing the Euclidean distance between the sequenced samples. The samples of the treatment groups form separate clusters. (C) Number of upregulated (blue) and downregulated (pink) genes with a log2 fold change of at least 1 and –1, respectively. (D, E) Validation of the RNA-seq data using RT-qPCR. Bar diagrams showing log2 fold change of expression levels between embryos injected with mondoa-mo and mondoa-mis injected controls for ten randomly chosen differentially expressed genes as determined by RNA-seq (D) and RT-qPCR (E, n = 3). Abbreviations: sox3, SRY-box containing gene 3; tmprss4b, transmembrane protease serine 4b; adh5, alcohol dehydrogenase 5; cfl1, cofilin 1; vent, ventral expressed homeobox; lmnl3, lamin L3; dynlrb1, dynein light chain roadblock-type 1; gabarapl2, GABA(A) receptor-associated protein-like 2; aurkaip1, aurora kinase A interacting protein 1; nsdhl, NAD(P) dependent steroid dehydrogenase-like. Note also that reduction of vent expression was independently verified by WISH (Figure 4—figure supplement 1P). (F) Analysis of spatial distribution of nsdhl transcripts at 4 cell, 50% epiboly (50% epi) and 21 somite stages by WISH. Expression was detected in the blastodisc and is ubiquitous during later stages. Scale bar: 0.2 mm. (G) Epon sections of 50% epiboly (50% epi.) stage embryos show nsdhl expression in the enveloping layer (EVL) and in the deep cell layer (DEL) of the blastoderm (Bl) as well as in the yolk syncyctial layer (YSL). Scale bar: 0.2 mm left panels and 50 µm right panels. The same staining pattern was observed for two probes directed against different portions of the transcript (probe 1 and probe 2).
|