FIGURE

Figure 5

ID
ZDB-FIG-200814-37
Publication
Lee et al., 2020 - Methiothepin Suppresses Human Ovarian Cancer Cell Growth by Repressing Mitochondrion-Mediated Metabolism and Inhibiting Angiogenesis In Vivo
Other Figures
All Figure Page
Back to All Figure Page
Figure 5

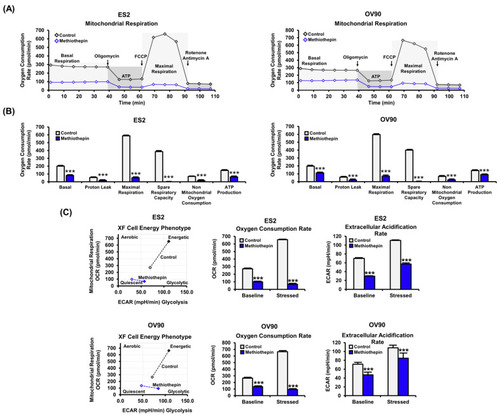
Metabolic profiling following methiothepin treatment in ES2 and OV90 cells. (A) The metabolic profiling changes in ES2 and OV90 cells following methiothepin treatment were analyzed by seahorse analysis with oligomycin, FCCP, Antimycin A, and Rotenone treatment. (B) Basal OCR, proton leak, maximal respiration, and ATP production were analyzed as the metabolic parameters in ES2 and OV90 cells in response to treatment with methiothepin. (C) The energy phenotypes in ES2 and OV90 cells were obtained by seahorse assay following treatment with methiothepin. In ES2 and OV90 cells, oxygen consumption rate and extracellular acidification rate under baseline (open marker) and stressed (closed marker) conditions following methiothepin treatment were analyzed. Results are expressed as the means ± SDs of three independent experiments. The asterisks indicate statistically significant differences compared to the control (*** p < 0.001).

Expression Data

Expression Detail
Antibody Labeling
Phenotype Data

Phenotype Detail
Acknowledgments
This image is the copyrighted work of the attributed author or publisher, and ZFIN has permission only to display this image to its users. Additional permissions should be obtained from the applicable author or publisher of the image. Full text @ Pharmaceutics