|
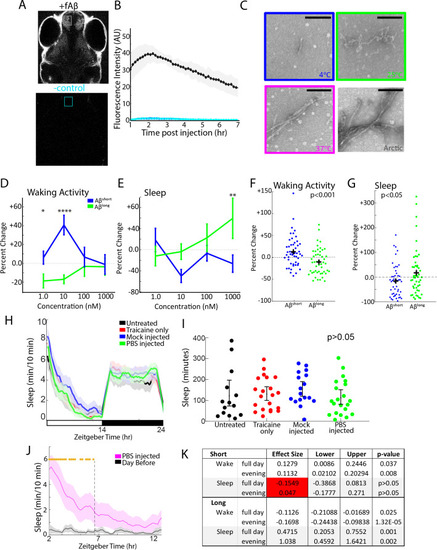
Aβ oligomers exert dose-dependent, short-term effects on zebrafish sleep.(A) Same images from Figure 1B, highlighting the region of interest in the telencephalon for fluorescence intensity measurements in B. Anterior is to the top, dorsal view. (B) Heart-injected fluorescently-tagged Aβ (black) penetrates the brain within 1 hr and peaks in concentration 2–3 hr post-injection. Cyan shows background fluorescence of a negative control. The shaded area shows ± standard deviation from three independent injections. (C) Electron micrographs of Aβ oligomers formed after 24 hr incubation at 4°C, 25°C, and 37°C. Aβarctic was incubated at 25°C for 2 hr as a positive control. The color code is used throughout the main and supplementary figures. Scale bar = 100 nm (D) The Aβshort (blue) and Aβlong (green) have opposing, dose-dependent effects on average waking activity, normalized to Aβrev injections. The error bars represent ±the SEM. doseXprep interaction *p≤0.05, ****p≤0.0001 two-way ANOVA, Fisher’s least significant difference post hoc test. p≤0.001, prep effect (plotted in F). (E) Aβshort (blue) and Aβlong (green) have opposing, dose-dependent effects on sleep. doseXprep interaction, two-way ANOVA, *p≤0.05, Fisher’s least significant difference post hoc test. p≤0.05, prep effect (plotted in G). Based on the data in D-E, 10 nM was chosen as the concentration for all subsequent Aβ injection experiments. (F) The waking activity for each larva in D, normalized to Aβrev injections and plotted to emphasize the significant effect of the preparation irrespective of dose (p<0.001, two-way ANOVA). (G) Sleep for each larva in E normalized to Aβrev injections and plotted to emphasize the significant effect of the preparation (p<0.001, two-way ANOVA). (H) Sleep plot of untreated WT (black), anesthetized only (red), mock injected (blue) and PBS injected (green) fish on a 14 hr:10 hr light:dark cycle (indicated by the white and black bars). The ribbons represent ±the SEM. (I) Sleep for each larva in H (WT (black), anesthetised only (red), mock injected (blue) and PBS injected (green)) shows that there is no statistical difference in sleep due to any of the manipulations (p>0.05, one-way ANOVA). (J) Sleep plot after vehicle injection (PBS, magenta trace) and immediate tracking compared to larvae that had acclimated to the apparatus for 24 hr (black trace). The ribbons represent ±the SEM. Gold stars flag significantly different timepoints (p<0.05, repeated measures ANOVA) and were used to determine the window for calculating the evening-only effects of Aβ injections. (K) Calculating Aβ injection effects across the whole day or only in the evening window (data from Figure 1) has minimal effect on the analysis of Aβshort or Aβlong. The only exception (red shading) is for the reduction in sleep by Aβshort, due to a flooring effect.
|