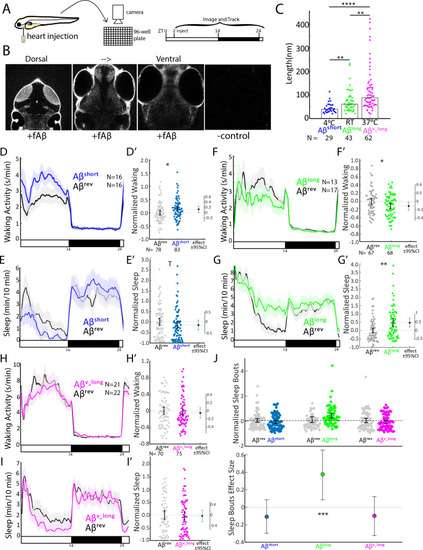
(A) Experimental schematic. Aβ was injected into the heart of 5 dpf larvae in the morning (ZT2 = zeitgeber time 2, that is 2hr after lights on). Behavior was then monitored in a square-welled 96-well plate for 24–48 hr on a 14 hr:10 hr light:dark cycle. (B) Heart-injected HiLyteTM Fluor 647-labeled Aβ42 (fAβ) penetrated the whole larval brain as visualized by confocal microscopy (optical sections, dorsal view) taken 2 hr after injection. Anterior is to the top. (C) Aβ prepared under increasing temperatures adopted longer oligomeric lengths, as measured by transmission electron microscopy. Each dot is a single oligomer (N = number measured), and the bars show the median. Data was taken from five randomly selected micrographs from two independent experiments. **p≤0.01, ****p≤1×10⁻⁷ Kruskal-Wallis, Tukey-Kramer post-hoc test. (D, E) Exemplar 24 hr traces post-injection comparing the effect of Aβshort (blue) on average waking activity (D) and sleep (E) versus Aβrev controls (grey). Ribbons represent ±the standard error of the mean (SEM). Light and dark bars indicate the lights ON and lights OFF periods, respectively. N = the number of larvae in each condition. (D’, E’) The effect of Aβshort relative to Aβrev on waking (D’) and sleep (E’) during the first day is shown, pooled from n = 5 independent experiments. Each dot represents a single larva normalized to the mean of the Aβrev control, and error bars indicate ± SEM. The mean difference effect size and 95% confidence interval is plotted to the right. *p<0.05, Tp <0.1, one-way ANOVA. (F, G) Exemplar 24 hr traces post-injection comparing the effect of Aβlong (green) on average waking activity (F) and sleep (G) versus Aβrev controls (grey). (F’, G’) The effect of Aβlong relative to Aβrev on waking (F’) and sleep (G’) during the first day is shown, pooled from n = 4 independent experiments. *p<0.05, **p<0.01, one-way ANOVA. (H, I) Exemplar 24 hr traces post-injection comparing the effect of Aβv_long (magenta) on average waking activity (H) and sleep (I) versus Aβrev peptide controls (grey). (H’, I’) The effect of Aβv_long relative to Aβrev on waking (H’) and sleep (I’) during the first day is shown, pooled from n = 3 independent experiments. (J) The effect of different Aβ preparations on the number of sleep bouts relative to Aβrev controls. The difference effect size and 95% confidence interval is plotted below. The asterisks indicate statistically significant different effects among the preps (***p<0.001, one-way ANOVA). See also Figure 1—figure supplements 1–3.
|
