FIGURE

Figure 2—figure supplement 2.

ID
ZDB-FIG-200715-10
Publication
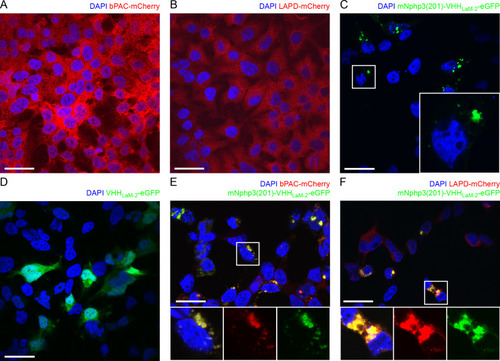
Hansen et al., 2020 - Nanobody-directed targeting of optogenetic tools to study signaling in the primary cilium
Other Figures
All Figure Page
Back to All Figure Page
Figure 2—figure supplement 2.

Subcelluar localization of nanobody-targeted optogenetic tools.

(A) HEK-TM cells expressing bPAC. HEK-TM cells stably expressing bPAC-mCherry (red) were fixed and labeled with DAPI (blue). Scale bar: 20 μm. (B) See A. for LAPD-mCherry. (C) HEK-TM cells expressing the cilia-targeted anti-mCherry mNphp3(201)-VHHLaM-2-eGFP (green) nanobody. The box indicates the position of the magnified view shown at the bottom right. (D) HEK-TM cells expressing the anti-mCherry VHHLaM-2-eGFP (green) nanobody. (E) Co-expression of the cilia-targeted anti-mCherry nanobody (LaM-2) (green) and bPAC-mCherry (red) in HEK-TM cells. The box indicates the position of the magnified view shown at the bottom: left: all channels as overlay; center: mCherry channel only; right: eGFP channel only. (F) Co-expression of the cilia-targeted anti-mCherry nanobody (LaM-2) (green) and LAPD-mCherry (red) in HEK-TM cells. The box indicates the position of the magnified view shown at the bottom: left: all channels as overlay; center: mCherry channel only; right: eGFP channel only.

Expression Data

Expression Detail
Antibody Labeling
Phenotype Data

Phenotype Detail
Acknowledgments
This image is the copyrighted work of the attributed author or publisher, and ZFIN has permission only to display this image to its users. Additional permissions should be obtained from the applicable author or publisher of the image. Full text @ Elife