|
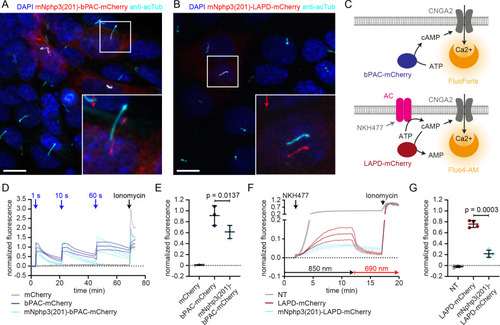
Direct ciliary targeting of optogenetic tools impairs protein function.(A) Localization of mNphp3(201)-bPAC-mCherry to primary cilia. mIMCD-3 cells expressing mNphp3(201)-bPAC-mCherry were labeled with an anti-acetylated tubulin antibody (cyan, ciliary marker) and with DAPI (blue) to label the DNA. The box indicates the position of the magnified view shown at the bottom right. Red arrow indicates the direction and the length of the shift of the respective fluorescence channel. Scale bar: 10 μm. (B) Localization of mNphp3(201)-LAPD-mCherry to primary cilia. mIMCD-3 cells expressing mNphp3(201)- LAPD-mCherry were labeled with an anti-acetylated tubulin antibody (cyan, ciliary marker) and DAPI (blue) to label the DNA. The box indicates the position of the magnified view shown at the bottom right. Red arrow indicates the direction and the length of the shift of the respective red channel. Scale bar: 10 μm. (C) Assays to measure bPAC or LAPD activity using Ca2+ imaging. HEK293 cells express the CNGA2-TM ion channel, which opens upon cAMP binding and conducts Ca2+ (HEK-TM) (Wachten et al., 2006). Light-dependent activation of bPAC increases intracellular cAMP levels, leading to a Ca2+ influx, which was quantified using a fluorescent Ca2+ dye (GFP-certified FluoForte). To measure LAPD activity, HEK-TM cells were pre-stimulated with 100 μM NKH477 to activate transmembrane adenylyl cyclases (AC), thus increasing cAMP levels. Ca2+ influx was detected by a Ca2+ dye (Fluo4-AM). (D) Quantification of bPAC activity. GFP-certified-FluoForte-loaded HEK-TM cells expressing mCherry only (grey), bPAC-mCherry (blue), or mNphp3(201)-bPAC-mCherry (cyan) were stimulated with 465 nm light pulses (1 mW/cm²) of different length and the increase in the intracellular Ca2+ concentration was measured. To evoke a maximal Ca2+ response, cells were stimulated with 2 μM ionomycin. Data are shown as mean ± SD (dotted lines) for the normalized fluorescence (F-F(baseline))/(F(ionomycin)-F(baseline))/fraction of mCherry-positive cells, n = 3 independent experiments (each data point represents the average of a duplicate or triplicate measurement). (E) Mean peak amplitudes of the Ca2+ signal at 3–6 min after the first light pulse. Data are shown as individual data points and mean ± SD, n = 3. (F) Quantification of LAPD activity. Fluo4-AM-loaded HEK-TM cells expressing LAPD-mCherry (red) or mNphp3(201)-LAPD-mCherry (cyan) were incubated with 100 μM NKH477 during continuous 850 nm light stimulation (0.5 µW/cm²). At steady-state, light stimulation was switched to 690 nm (0.5 µW/cm²). NT: non-transfected cells (grey). Data are shown as mean ± SD (dotted lines) for the normalized fluorescence (F-F(baseline))/(F(ionomycin)-F(baseline)). (G) Mean decrease of the Ca2+ signal after 690 nm light stimulation (fraction of maximum value after NKH477 increase), determined over 45 s at 3 min after switching to 690 nm. Data are shown as individual data points and mean ± SD, n = 4 independent experiments (each data point represents the average of a duplicate or triplicate measurement); p-values calculated using a paired, two-tailed t-test are indicated. NT: non-transfected cells.
|