|
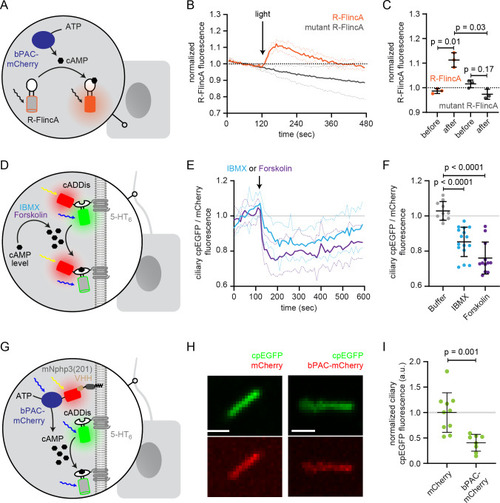
Functional characterization of bPAC in the cell body and cilium.(A) Schematic overview of the bPAC activity assay in non-ciliated HEK293 cells using R-FlincA (see B-C). (B) HEK293 cells were transfected with bPAC-eGFP and R-FlincA or the non-binding R-FlincA mutant (Ohta et al., 2018). The change in R-FlincA fluorescence was measured over time before and after photoactivation of bPAC (5 s, white light, 2.1 mW/cm2 at 480 nm). Data are shown as mean (solid lines)± S.D. (dotted lines), n = 3 with 4 cells per experiment. (C) Normalized R-FlincA or R-FlincA mutant fluorescence directly before and for the maximal amplitude after photoactivation. Data extracted from C; p-values have been calculated using a paired, two-sided Student’s t-test. (D) Schematic overview of the assay to measure ciliary cAMP dynamics using 5-HT6-mCherry-cADDis after pharmacologically increasing cAMP levels (see E-F). (E) Ciliary cAMP dynamics measured using 5-HT6-mCherry-cADDis. Cells were stimulated with 250 μM IBMX (light blue) or 40 μM Forskolin (purple). The normalized ratio of ciliary mCherry/cpEGFP fluorescence is shown as mean (solid lines)± S.D. (dotted lines); p-values have been calculated by paired, two-sided Student’s t-test. (F) Mean change in the normalized ratio of ciliary mCherry/cpEGFP fluorescence 60–120 s after stimulation with buffer, IBMX, or Forskolin. Data are shown as individual data points, the mean ± S.D. is indicated; p-values have been calculated by a two-sided Mann-Whitney test. (G) Schematic overview of the assay to measure light-evoked ciliary cAMP dynamics after bPAC stimulation using 5-HT6-cADDis (see H-I). (H) 5-HT6-cADDis fluorescence in cilia with mNphp3(201)-VHHLaM-2-HA targeted mCherry or bPAC-mCherry in the first frame of imaging. Scale bar: 2 μm. (I) Mean normalized ciliary cpEGFP fluorescence in the first frame. All data have been normalized to the mean cpEGFP fluorescence in the mCherry control. Data are shown as individual data points, the mean ± S.D. is indicated; p-values have been calculated by unpaired, two-sided Student’s t-test.
|