
Figure 4
- ID
- ZDB-FIG-200715-12
- Publication
- Hansen et al., 2020 - Nanobody-directed targeting of optogenetic tools to study signaling in the primary cilium
- Other Figures
- All Figure Page
- Back to All Figure Page
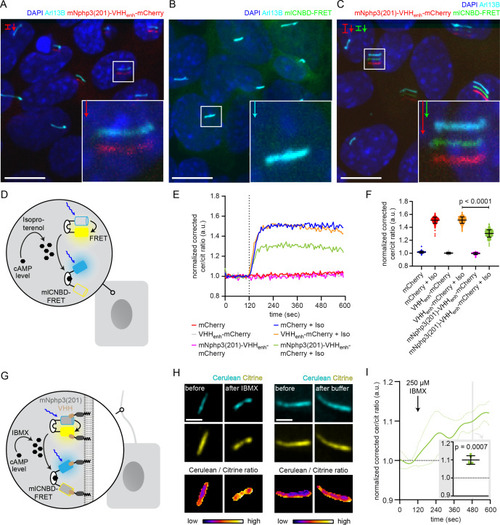
(A) Localization of the mNphp3(201)-VHHenhancer-mCherry anti-eGFP nanobody to primary cilia. (B./C) Localization of mlCNBD-FRET in mIMCD-3 cells in the (B) absence or (C) presence of mNPHP3(201)-VHHenhancer-mCherry. (D) Schematic overview of mlCNBD-FRET imaging in non-ciliated HEK293 cells (see E-F). (E) FRET imaging in HEK293 mlCNBD-FRET cells transiently co-expressing mCherry, VHHenhancer-mCherry, or mNphp3(201)-VHHenhancer-mCherry under control conditions or after stimulation with 20 μM isoproterenol (Iso, addition depicted with dotted line). Data are shown as mean (n = 3 independent experiments, 30–90 cells per experiment). (F) Comparison of maximal change for data shown in E. Data are presented as individual data points and mean ± S.D.; p-value calculated using an unpaired, two-tailed Mann-Whitney test is indicated. (G) Schematic overview of mlCNBD-FRET imaging in the primary cilium of mIMCD-3 cells (see H-I). (H) FRET imaging in primary cilia of mIMCD-3 cells expressing mlCNBD-FRET and mNphp3(201)-VHHenhancer-mCherry. Cells have been stimulated with 250 μm IBMX (left) or buffer only (right). Cerulean and citrine are shown before and after stimulation with IMBX. The change in cerulean/citrine ratio is shown below (color-scheme indicated at the bottom). Scale bar: 2 μm. (I) Time course of mean change in FRET (dark green line)± S.D. (dotted green line) for data set, exemplary shown in H; n = 5. Inset: each data point shows the time-average per cilium at the position indicated by grey box; one-sample Student’s t-test compared to 1.0 indicated. |