|
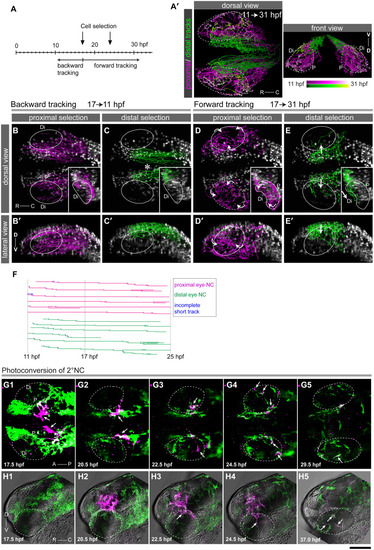
Systematic tracking of 1°NC and 2°NC cells.DSLM time series of a double transgenic embryo expressing nuclear Eos in NC cells [green, Tg(sox10:h2a-tdEosFP)] and nuclear mCherry from the Wnt reporter. (A-F) Tracking analysis of 1°NC and 2°NC cells. Two groups of h2a-tdEosFP-positive NC cells which were located at either the proximal or distal side of the optic cup were selected at 17 and 24 hpf for systematic backward (B-C’) and forward tracking (D-E’), relative to 17 hpf (A). (A’) Dorsal and front views of trajectories of NC cells destined for the proximal (magenta, 474 cells) or the distal side (green, 610 cells) of the eye are presented with colour-codes for approximate time periods. Stippled circles represent the optic cup. B-E, dorsal projection view; B’-E’, lateral projection. With reference to the time of cell selection (17 hpf), backward (17–11 hpf, B-C’) and forward tracking (17–31 hpf, D-E’) results are shown. Individual tracks are colour-coded for stages to indicate the temporal cell position (A). Tracks are merged onto the maximum projections at the end of the tracking period (17 hpf, B-C; 31 hpf, D-E; see also S5 Video for three-dimensional presentation). 2°NC cells at the dorsal edge of the eye originate from the diencephalon and mesencephalon (asterisk, C) and migrate into the distal side of the eye (arrows in E) from the dorsal edge (arrow in E’). Circles in the panels outline the eye. Insets in B-E show transverse sections made at the lens highlighting cell migration paths relative to the proximal (P) and distal (Di) side of the eye. Orientations: rostral (R), caudal (C), dorsal (D), ventral (V). (F) Depiction of six representative lineages for each of the proximal (magenta) or distal (green) destined group. Each branch corresponds to a cell division. Incomplete short tracks are shown in blue. (G-H) Time lapse analysis of locally green-to-red photoconverted 2°NC cells at 17 hpf (G) and 20 hpf (H). Arrows indicate 2°NC cells reaching the distal side of the eye. G, dorsal projection view; H, lateral projection. Scale bar: B-E’: 100 μm; G-H: 75 μm.
|