
Figure 2
- ID
- ZDB-FIG-200523-5
- Publication
- Hailstone et al., 2020 - CytoCensus, mapping cell identity and division in tissues and organs using machine learning
- Other Figures
- All Figure Page
- Back to All Figure Page
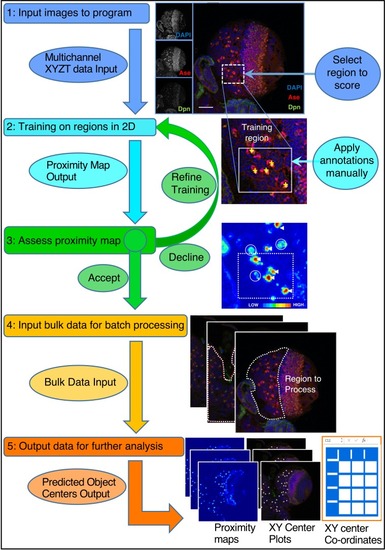
Refer to the Main Text and Materials and methods for details. Training is performed by single click annotation (yellow crosses) within a user-defined region of interest (ROI, white dashed square) to identify the cell class of interest. The resultant proximity map for cell class identification (~probability score for object centres) is evaluated manually to assess the success of training (white arrows indicate good detections and circles indicate where more training may be required). A successful identification regime (Model) is saved and may be used to batch process multiple image data sets. Multiple outputs are produced including a list of the co-ordinates of identified cells. Multiple identification regimes can be sequentially applied to identify multiple cell classes from a single data set. |