
Figure 6
- ID
- ZDB-FIG-200523-16
- Publication
- Hailstone et al., 2020 - CytoCensus, mapping cell identity and division in tissues and organs using machine learning
- Other Figures
- All Figure Page
- Back to All Figure Page
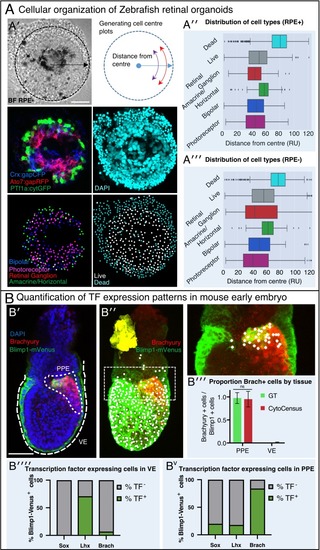
(A) Automated analysis of Zebrafish retinal organoids at the single-cell level. Raw data from Eldred et al. (2017). (A′) Top: brightfield image and diagram indicating the location of cells was defined as displacement from the organoid center. Middle: Cell fate marker expression (Crx:gapCFP; Ato7:gapRFP; PTf1a:cytGFP) and DAPI. Bottom: Cell centre identification by CytoCensus for the different cell types as defined by the labelling profiles (Bipolar, Photoreceptor, Retinal Ganglion, Amacrine/Horizontal, Live/Dead). (A′′-A′′′) Radial distribution of the different cell types determined from cell centre identifications by CytoCensus; the effects on organoid organisation of the presence (A′′) or absence (A′′′) of retinal pigment epithelium (RPE) cells is examined (ns, one-way ANOVA). RU = Radial Units, normalised to a radius of 100 (see Materials and methods) (B) Automated quantification of TF expressing cells in a fixed early streak stage mouse embryo (e6.5) labelled for transcription factors, Blimp1-mVenus and DAPI. (B′) A medial confocal section showing Brachyury in the primitive streak in the proximal posterior epiblast (PPE) and visceral endoderm (VE, highlighted cortical tracing). (B′′) Cortical image of the same mouse embryo overlaid with total cell centre predictions by CytoCensus of Brachyury positive cells; insert to the right is a zoomed in image of the highlighted rectangle showing only cell centre predictions in a single medial plane. (B′′′) Comparison of CytoCensus and manual Ground Truth (GT) measurements of the proportion of Brachyury positive cells from 2D planes in the VE and PPE (ns, t-test, n = 3). (B′′′′-Bv) Proportion of transcription factor positive cells (TF) in, using CytoCensus measurements in 3D according to tissue regions (PPE and VE) defined in (B′). Scale bars 25 µm in (A); 100 µm in (B′). |