
Figure 3—figure supplement 2.
- ID
- ZDB-FIG-200523-10
- Publication
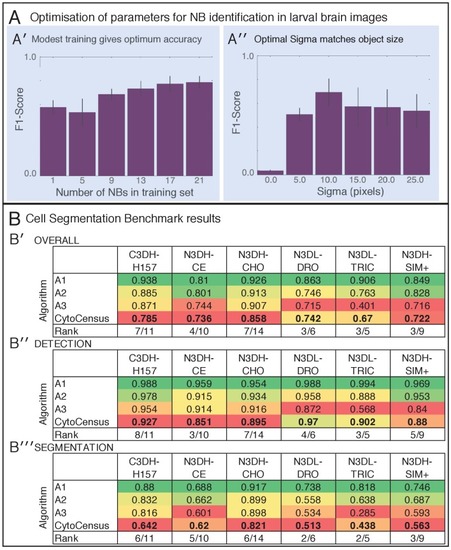
- Hailstone et al., 2020 - CytoCensus, mapping cell identity and division in tissues and organs using machine learning
- Other Figures
- All Figure Page
- Back to All Figure Page
Related to |