
Figure 1
- ID
- ZDB-FIG-200504-5
- Publication
- Schauer et al., 2020 - Zebrafish embryonic explants undergo genetically encoded self-assembly
- Other Figures
-
- Figure 1
- Figure 1—figure supplement 1
- Figure 1—figure supplement 2
- Figure 1—figure supplement 3.
- Figure 1—figure supplement 4
- Figure 2
- Figure 2—figure supplement 1
- Figure 2—figure supplement 2
- Figure 2—figure supplement 3
- Figure 3
- Figure 3—figure supplement 1
- Figure 4
- Figure 4—figure supplement 1
- Figure 4—figure supplement 2
- Figure 4—figure supplement 3
- Figure 5
- Figure 5—figure supplement 1
- Figure 6
- Figure 6—figure supplement 1
- All Figure Page
- Back to All Figure Page
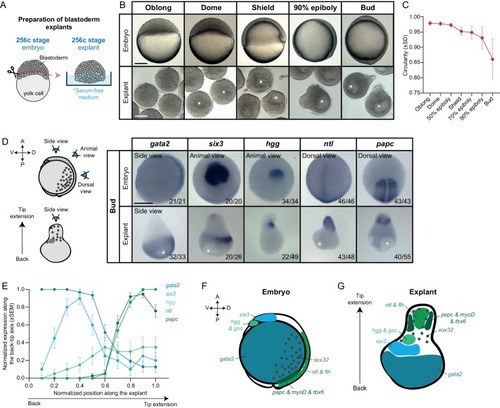
(A) Schematic representation of the preparation method of blastoderm explants from 256 cell stage (256 c) stage embryos. (B) Bright-field single-plane images of stage-matched embryo and blastoderm explants from oblong to bud stage. The white dashed lines outline the shape of the explant. (C) Circularity of blastoderm explants from oblong to bud stage (oblong: n = 42, dome: n = 34, 50% epiboly: n = 35, shield: n = 40, 70% epiboly: n = 35, 90% epiboly: n = 36, bud: n = 38; N = 2). (D) Expression of ectoderm (gata2), neuroectoderm (six3) and mesendoderm (hgg, ntl and papc) marker genes as determined by whole mount in situ hybridization of bud stage embryos and blastoderm explants. Schematic representation of the different views for embryos and blastoderm explants is shown on the left. The proportion of embryos or blastoderm explants with a phenotype similar to the images shown is indicated in the lower right corner (gata2: embryos, n = 21, N = 4, explants, n = 33, N = 6; six3: embryos, n = 20, N = 3, explants, n = 26, N = 4; hgg: embryos, n = 34, N = 5, explants, n = 49, N = 5; ntl: embryos, n = 46, N = 4, explants, n = 48, N = 4; papc: embryos, n = 43, N = 4, explants, n = 55, N = 5). (E) Normalized expression domain of ectoderm (gata2: n = 31, N = 6), neuroectoderm (six3: n = 20, N = 4) and mesendoderm (hgg: n = 20, N = 5; ntl: n = 41, N = 4; papc: n = 37, N = 5) marker genes along the back-tip axis of bud stage blastoderm explants. (F-G) Schematic representation of ectoderm, neuroectoderm, mesendoderm and endoderm marker gene expression domains in intact embryos (F) and blastoderm explants (G). White asterisks denote the main luminal cavity in explants. Scale bars: 200 µm (B, D). |