
Figure 4
- ID
- ZDB-FIG-200504-16
- Publication
- Schauer et al., 2020 - Zebrafish embryonic explants undergo genetically encoded self-assembly
- Other Figures
-
- Figure 1
- Figure 1—figure supplement 1
- Figure 1—figure supplement 2
- Figure 1—figure supplement 3.
- Figure 1—figure supplement 4
- Figure 2
- Figure 2—figure supplement 1
- Figure 2—figure supplement 2
- Figure 2—figure supplement 3
- Figure 3
- Figure 3—figure supplement 1
- Figure 4
- Figure 4—figure supplement 1
- Figure 4—figure supplement 2
- Figure 4—figure supplement 3
- Figure 5
- Figure 5—figure supplement 1
- Figure 6
- Figure 6—figure supplement 1
- All Figure Page
- Back to All Figure Page
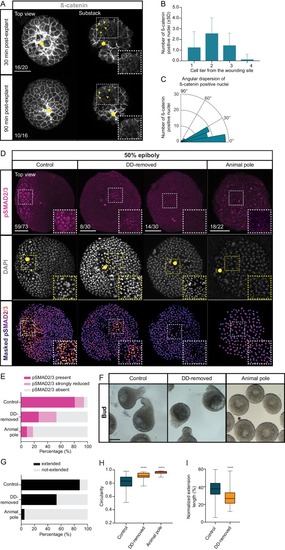
Maternal pre-patterning is required for Nodal signaling in blastoderm explants. (A) High-resolution fluorescence images of blastoderm explants 30 and 90 min post-explanting stained for both β-catenin (grey) and DAPI (not shown). Both full projection and substack top views are shown to facilitate simultaneous visualization of the wounding site (yellow circle) and nuclear accumulation of β-catenin (yellow arrowheads). Insets are zoom-in images of the highlighted regions (dashed boxes). The proportion of blastoderm explants with a phenotype similar to the images shown is indicated in the lower left corner (30 min: n = 20, N = 6; 90 min: n = 16, N = 4). (B) Number of β-catenin positive nuclei 30 min post-explant preparation as a function of the distance to the wounding site, expressed as cell tiers (n = 16, N = 6). (C) Angular dispersion of β-catenin positive nuclei 30 min post-explant preparation (for details see Materials and methods; n = 16, N = 6). (D) High-resolution fluorescence images of control, dorsal determinants-removed (DD-removed) and animal pole explants at 50% epiboly stained for both pSMAD2/3 (pink) and DAPI (grey). Nuclear pSMAD2/3 is color-coded using a fire lookup table (highest intensities in yellow) and was masked based on the DAPI signal. Insets are zoom-in images of the highlighted regions (dashed boxes) and the yellow circles denote the wounding site. The proportion of blastoderm explants with a phenotype similar to the images shown is indicated in the lower left corner (control: n = 73, N = 14; DD-removed: n = 30, N = 7; animal pole: n = 22, N = 6). (E) Percentage of control (n = 73, N = 14), DD-removed (n = 30, N = 7) and animal pole (n = 22, N = 6) explants showing a domain of pSMAD2/3 positive nuclei (present), a few sporadic pSMAD2/3 positive nuclei (strongly reduced) or no positive nuclei (absent) at 50% epiboly (see Materials and methods for additional details). (F) Bright-field single-plane images of control (n = 228, N = 15), DD-removed (n = 75, N = 8) and animal pole (n = 42, N = 5) explants at bud stage. Control explants partially correspond to explants shown in Figure 1—figure supplement 2A–D. (G) Percentage of extended or not-extended control (n = 228, N = 15), DD-removed (n = 75, N = 8) and animal pole (n = 42, N = 5) explants at bud stage. (H) Circularity of control (n = 228, N = 15), DD-removed (n = 75, N = 8) and animal pole (n = 42, N = 5) explants at bud stage. ****p<0.0001 (Kruskal-Wallis test). (I) Normalized extension length of extended control (n = 199, N = 15) and DD-removed (n = 40, N = 8) blastoderm explants at bud stage. ****p<0.0001 (Unpaired t test). Scale bars: 100 µm (A,D), 200 µm (F). |