<styled-content toggle='no' style='fixed-case'>CEP</styled-content>41 regulates angiogenesis via <styled-content toggle='no' style='fixed-case'>AURKA</styled-content>‐activated mechanotransduction
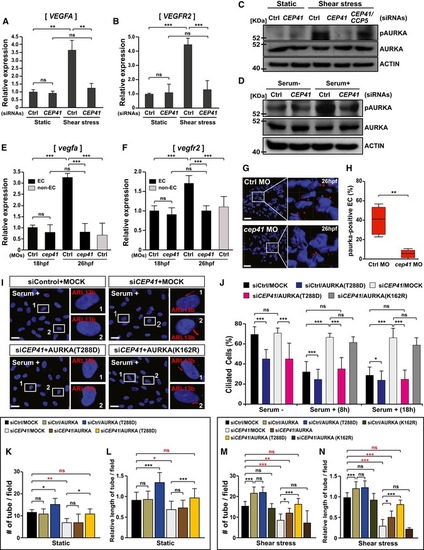
VEGFA (A) and VEGFR2 (B) mRNA levels quantified by qRT–PCR in control or CEP41‐knockdown HUVECs under static or shear stress conditions. The expression of GAPDH was quantified for the normalization of the qRT–PCR results. Data are shown as mean ± SD of three independent experiments. Statistical significance was determined with the Brown–Forsythe ANOVA followed by Dunnett's T3 post hoc test (**P <0.01, ***P <0.001, ns: non‐significant).
Immunoblot assays for phospho‐AURKA and AURKA were performed in HUVECs (C) and hTERT‐RPE1 cells (D) transfected with the indicated siRNAs. Protein levels were normalized against β‐actin in the same blots.
The mRNA levels of zebrafish vegfa (E) and vegfr2 (F) were quantified by qRT–PCR in eGFP‐positive ECs of control‐ or cep41‐MO‐injected Tg(kdrl:eGFP) zebrafish at 18 hpf (low shear stress) and 26 hpf (high shear stress). The expression of vegfa and vegfr2 was quantified in neuronal cells from control MO‐injected zebrafish for comparisons with that of ECs. The expression of zebrafish β‐actin was quantified for the normalization of those qRT–PCR results. Data are shown as mean ± SD of three independent experiments. Statistical significance was determined using the one‐way ANOVA followed by Tukey's post hoc test (***P <0.001, ns: non‐significant).
Tg(kdrl:eGFP) zebrafish were injected with control‐ or cep41‐MOs and subjected to immunostaining with phospho‐AURKA‐specific antibodies (red) and DAPI at 26 hpf. The insets indicate the representative area from each immunostaining experiment, and the red dots indicate EC AURKA activation. Scale bars, 40 μm. Quantification of the phospho‐AURKA‐positive ECs (H) in equivalent fields of view for each MO‐injected zebrafish in images in (G) is the result of three independent experiments with ≥ 10 embryos per condition. The top and bottom whiskers represent the maximum and minimum values, respectively. **P <0.01 (unpaired Student's t‐test with Welch's correction).
CEP41‐depleted hTERT‐RPE1 cells were transfected with vectors encoding nothing (MOCK), AURKA‐T288D, or AURKA‐K162R and then immunostained with ARL13b‐specific antibodies after serum starvation or serum retrieval. Images were taken from the results of staining done 18 h after serum retrieval. Rectangles indicate the representative cells that appear in the magnified images in the right panels. Scale bars, 20 μm. A quantification of ARL13b‐labeled ciliated cells under the indicated conditions in (J). These are the results of three independent experiments with ≥ 200 cells per condition (mean ± SD). *P <0.05, ***P <0.01, ns: non‐significant (two‐way ANOVA with Tukey's post hoc test).
Control and CEP41‐deficient HUVECs were transfected with expression vectors encoding nothing (MOCK), AURKA, AURKA‐T288D, or AURKA‐K162R and subjected to an in vitro angiogenesis assay for 18 h under static (K, L) or shear stress (M, N) states. Quantification of tube node number in (K, M) and tube length in (L, N) from data examined within equivalent fields of view at each time point using the ImageJ angiogenesis analyzer. Data are shown as mean ± SD of five independent experiments with ≥ 5 tubulogenesis regions per condition. Statistical significance was determined using the two‐way ANOVA followed by Tukey's post hoc test (*P <0.05, **P <0.01, ***P <0.001, ns: non‐significant).
This image is the copyrighted work of the attributed author or publisher, and
ZFIN has permission only to display this image to its users.
Additional permissions should be obtained from the applicable author or publisher of the image.
Full text @ EMBO Rep.
Your Input Welcome
Thank you for submitting comments. Your input has been emailed to ZFIN curators who may contact you if
additional information is required.
Oops. Something went wrong. Please try again later.