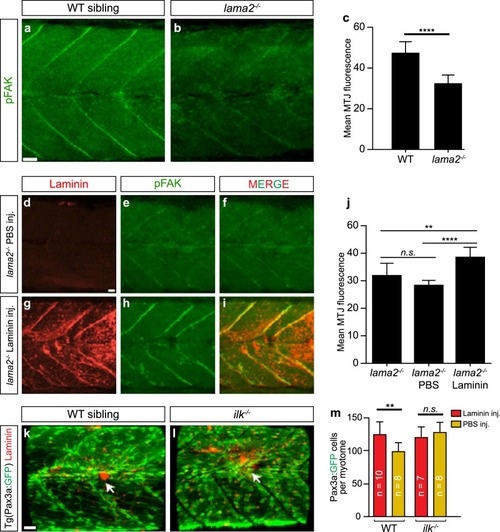
Laminin stimulation of stem cell proliferation requires downstream integrin signalling. a, b Representative images of phosphorylated-FAK expression (green) within skeletal muscle of 6 dpf lama2−/− or sibling zebrafish. Scale bar, 20 μm. c Quantification of expression levels of p-FAK at the myotendious junctions of 6 dpf lama2−/− or sibling zebrafish. Results are expressed as mean ± SD. Statistics: t‐test, two tailed; *p < 0.05, **p < 0.01, ***p < 0.001, ****p < 0.0001. d–i Representative images of p-FAK expression (green) in 6 dpf lama2−/− zebrafish treated with laminin protein (red) or PBS. Note the colocalization of both these proteins at the myotendious junctions. Scale bar, 20 μm. j Quantification of expression levels of p-FAK at the myotendious junctions of 6 dpf lama2−/− zebrafish that were either treated with exogenous laminin, PBS (orange) or untreated. Results are expressed as a mean ± SD. Statistics: one-way ANOVA, Tukey’s test; *p < 0.05, **p < 0.01, ***p < 0.001, ****p < 0.0001. k, l Representative images of Laminin treatment in the ilk−/− mutant. White arrow indicates where intramuscular injection took place. Muscle stem cells marked by TgBAC(pax3a:GFP). Scale bar, 20 μm. m Quantitative analysis shows there is no significant effect on the ilk−/− mutant when laminin treated; ilk−/− mutant zebrafish were either treated with exogenous laminin or PBS. Results are expressed as a mean ± SD. For each group, n ≥ 6. Statistics: one-way ANOVA, Tukey’s test; *p < 0.05, **p < 0.01. Scale bars, 20 μm
|
