
Fig. 6
- ID
- ZDB-IMAGE-191230-763
- Publication
- Hall et al., 2019 - Cellular rescue in a zebrafish model of congenital muscular dystrophy type 1A
- All Figures
- Figures for Hall et al., 2019
|
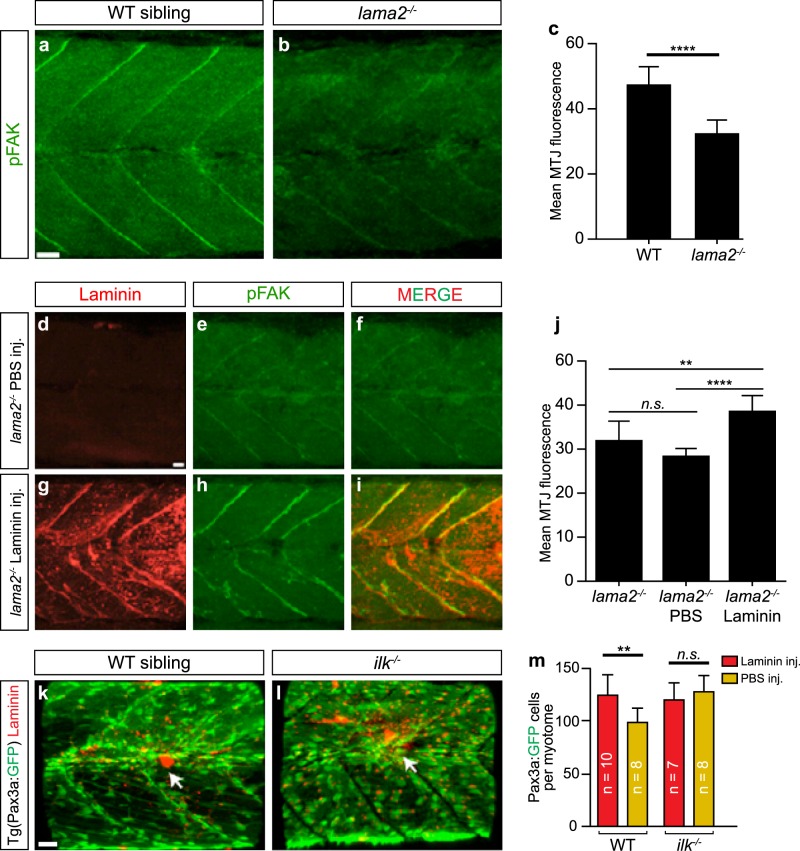
Fig. 6
Laminin stimulation of stem cell proliferation requires downstream integrin signalling.